Review
. 2005 Oct 5;9(5):472-84.
doi: 10.1186/cc3516. Epub 2005 Apr 18.

Clinical review: respiratory mechanics in spontaneous and assisted ventilation

Affiliations
Review

Clinical review: respiratory mechanics in spontaneous and assisted ventilation

Daniel C Grinnan et al. Crit Care. .

Abstract

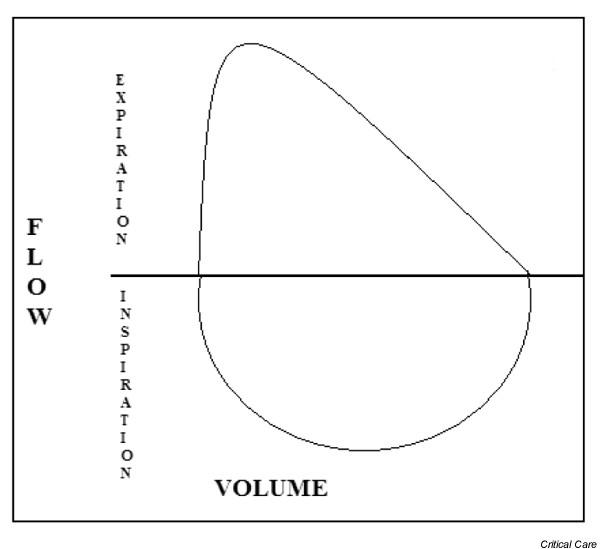
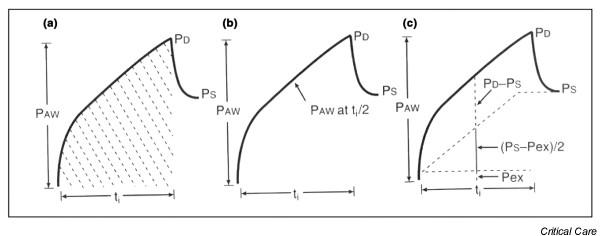
Pulmonary disease changes the physiology of the lungs, which manifests as changes in respiratory mechanics. Therefore, measurement of respiratory mechanics allows a clinician to monitor closely the course of pulmonary disease. Here we review the principles of respiratory mechanics and their clinical applications. These principles include compliance, elastance, resistance, impedance, flow, and work of breathing. We discuss these principles in normal conditions and in disease states. As the severity of pulmonary disease increases, mechanical ventilation can become necessary. We discuss the use of pressure-volume curves in assisting with poorly compliant lungs while on mechanical ventilation. In addition, we discuss physiologic parameters that assist with ventilator weaning as the disease process abates.


Figures

Figure 1
Figure 1
Pressure–volume curve. Shown is a pressure–volume curve developed from measurements in isolated lung during inflation (inspiration) and deflation (expiration). The slope of each curve is the compliance. The difference in the curves is hysteresis. Reprinted from [3] with permission from Elsevier.
Figure 2
Figure 2
Compliance of the lungs, chest wall, and the combined lung–chest wall system. At the functional residual capacity, the forces of expansion and collapse are in equilibrium. Reprinted from [3] with permission from Elsevier.
Figure 3
Figure 3
Compliance in emphysema and fibrosis. Shown are changes in the compliance of the inspiratory limb of the pressure–volume curve with respect to (a) chest wall, (b) lungs, and (c) combined lung-chest wall system in patients with emphysema and fibrosis. The functional residual capacity (FRC), represented on the vertical axis at a transmural pressure of 0, is elevated in emphysema, which can lead to dynamic hyperinflation. Reprinted from [3] with permission from Elsevier.
Figure 4
Figure 4
Ventilator tracing with a square wave, or constant flow, pattern. Note that the machine is triggered to initiate a breath before flow returns to zero (the horizontal axis). This indicates that auto-PEEP (positive end-expiratory pressure) is present and directs the clinician to investigate further.
Figure 5
Figure 5
The inspiratory limb of the pressure–volume curve (dark line) divided into three sections. Section 1 (low compliance) and section 2 (high compliance) are separated by the lower inflection point (LIP). Section 2 (high compliance) and section 3 (low compliance) are separated by the upper inflection point (UIP). In this example, the LIP is marked at the point of crossing of the greatest slope in section 2 and the lowest slope of section 1. The UIP is marked at the point of 20% decrease from the greatest slope of section 2 (a calculated value).
Figure 6
Figure 6
Flow–volume loop. A flow–volume loop is shown, with exhalation above the horizontal axis and inspiration below.
Figure 7
Figure 7
The maximal flow–volume curve. The isovolume flow–pressure curve (left) is created from measurements of pleural pressure and expiratory flow at different volumes of forced expiration. These measurements can be extrapolated to show a maximal flow–volume curve (right). Note that, at a volume specific pleural pressure, the maximal expiratory flow will be limited. VC, vital capacity. Reprinted from [1] with permission from Elsevier.
Figure 8
Figure 8
Calculating the work of breathing during spontaneous ventilation using an esophageal balloon. Area A represents the work to move air into and out of the lungs. Area B represents the work to expand the chest wall and is calculated from a pressure–volume curve in a passive patient receiving a mechanically generated breath. The sum of A and B represents the total work of breathing, and it can be determined through integration of the product of esophageal pressure and flow. Reprinted from [1] with permission from Elsevier.
Figure 9
Figure 9
Calculation of work per liter of ventilation (Pavg) in a passive patient on constant-flow mechanical ventilation. Pavg can be calculated by three methods. (a) Dividing the integral of the airway pressure (Paw) by the inspiratory time (Ti). (b) Recording the airway pressure at the mid-inspiratory time (Ti/2). (c) Calculating Pd - (Ps - Pex)/2, where Pd = peak inspiratory pressure, Ps = estimate of end-inspiratory pressure, and Pex = estimate of end-expiratory pressure. Reprinted from [1] with permission from Elsevier.
Figure 10
Figure 10
Energy expenditure determined by the pressure time product (PTP) in a patient on pressure support ventilation. In all graphs, the continuous line is esophageal pressure (Pes) and the interrupted line represents the estimated recoil pressure of the chest wall (Pescw). (a) Pressure tracings have been superimposed so that Pescw is equal to Pes at the onset of the first inspiratory effort, and the integrated difference (hatched area) represents the upper bound PTPinsp. (b) Pressure tracings have been superimposed so that Pescw is equal to Pes at the first moment of transition from expiratory to inspiratory flow, and the integrated difference (hatched area) represents lower bound PTPinsp. (c) Pressure tracings are superimposed so that Pescw is equal to Pes at the second moment of transition from expiratory to inspiratory flow, and the integrated difference (hatched area) represents upper bound expiratory PTP (PTPexp). (d) Pressure tracings have been superimposed so that Pescw is equal to Pes at the onset of the second inspiratory effort, and the integrated difference (hatched area) represents lower bound PTPexp. With permission from Jubran et al. [56].

References

    1. Truwit JD. Lung mechanics. In: Dantzer DR, MacIntyre NR, Bakow ED, editor. Comprehensive Respiratory Care. Philadelphia: WB Saunders Co; 1995. pp. 18–31.
    1. Kallet RH. Pressure-volume curves in the management of acute respiratory distress syndrome. Respir Care Clin N Am. 2003;9:321–341. doi: 10.1016/S1078-5337(03)00041-8. - DOI - PubMed
    1. Costanzo LS. Physiology. 2. Philadelphia: WB Saunders Co; 2002.
    1. MacIntyre NR. Evidence-based guidelines for weaning and discontinuing ventilatory support. Chest. 2001;120:375S–396S. doi: 10.1378/chest.120.6_suppl.375S. - DOI - PubMed
    1. Mehta S, Stewart TE, MacDonald R, Hallett D, Banayan D, Lapinsky S, Slutsky A. Temporal change, reproducibility, and inter-observer variability in pressure-volume curves in adults with acute lung injury and acute respiratory distress syndrome. Crit Care Med. 2003;31:2118–2125. doi: 10.1097/01.CCM.0000069342.00360.9F. - DOI - PubMed

MeSH terms