

Osteoblast response to zirconia-hybridized pyrophosphate-stabilized amorphous calcium phosphate
- PMID: 16278876
- PMCID: PMC1477539
- DOI: 10.1002/jbm.a.30573
Osteoblast response to zirconia-hybridized pyrophosphate-stabilized amorphous calcium phosphate
Abstract
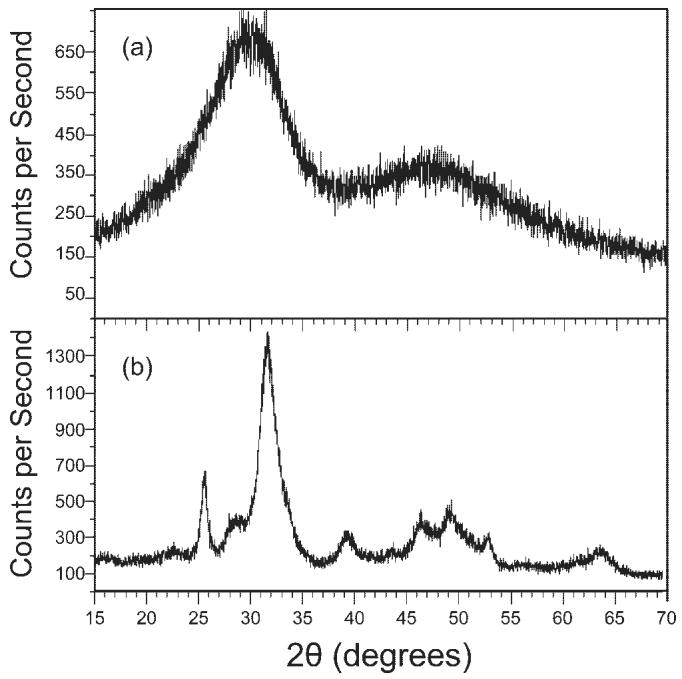
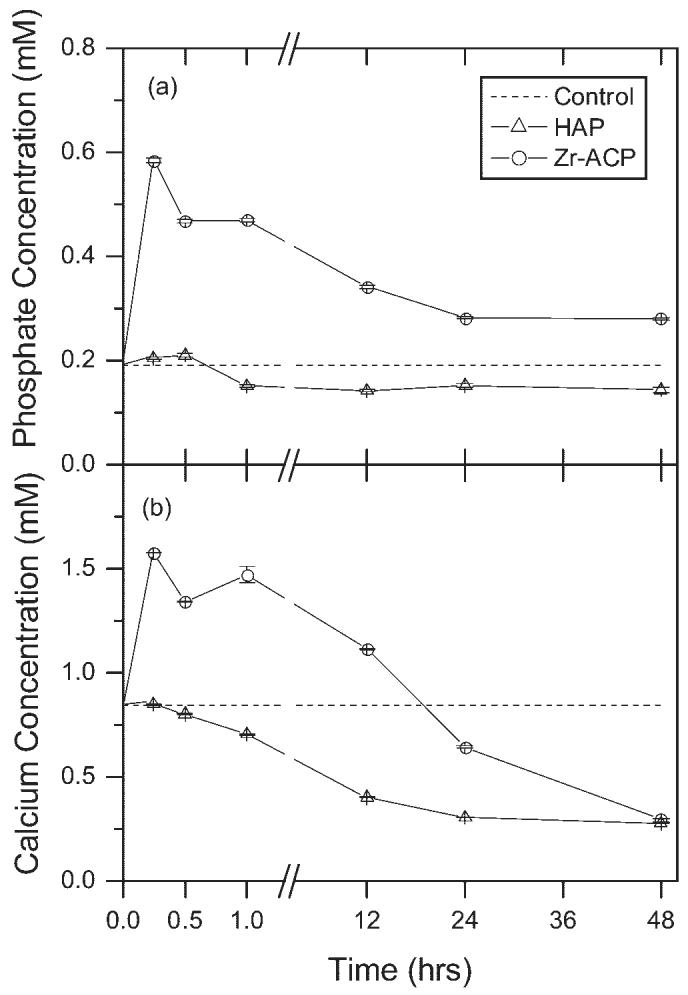
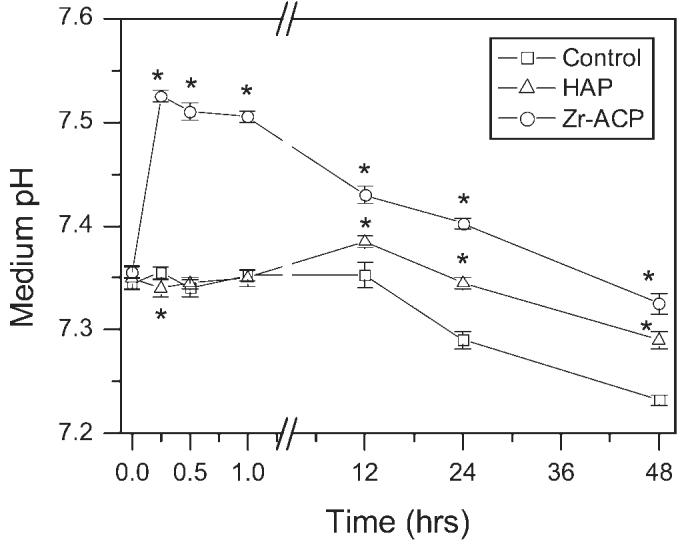
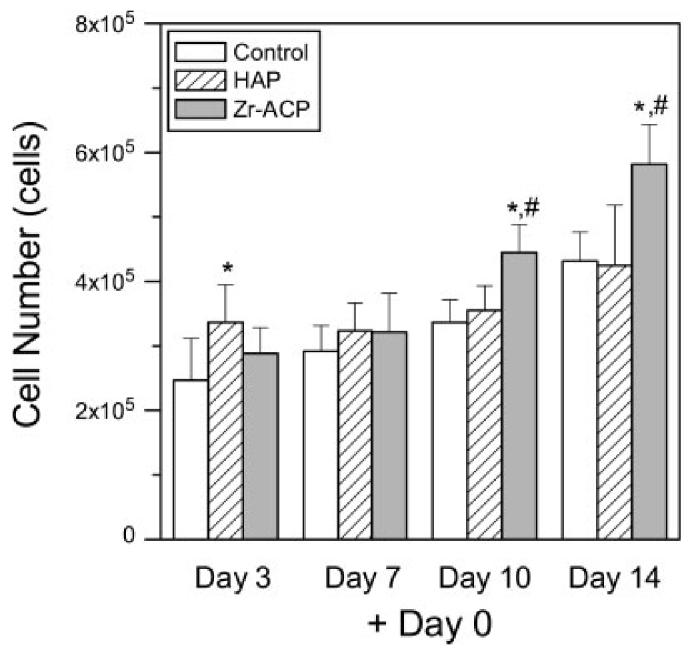
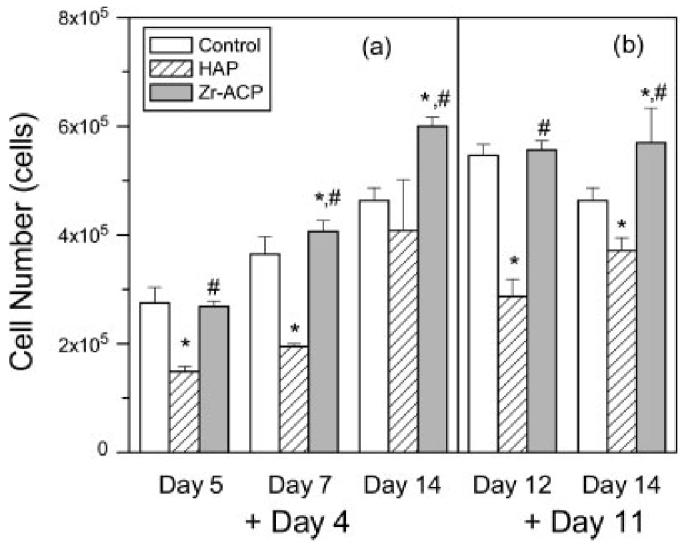
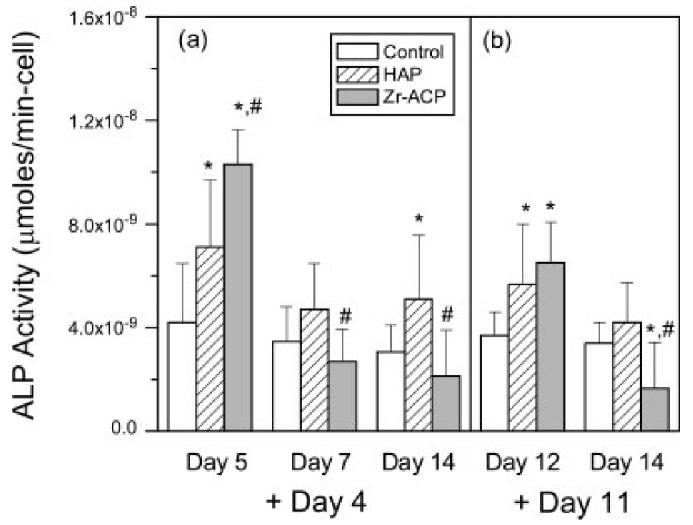
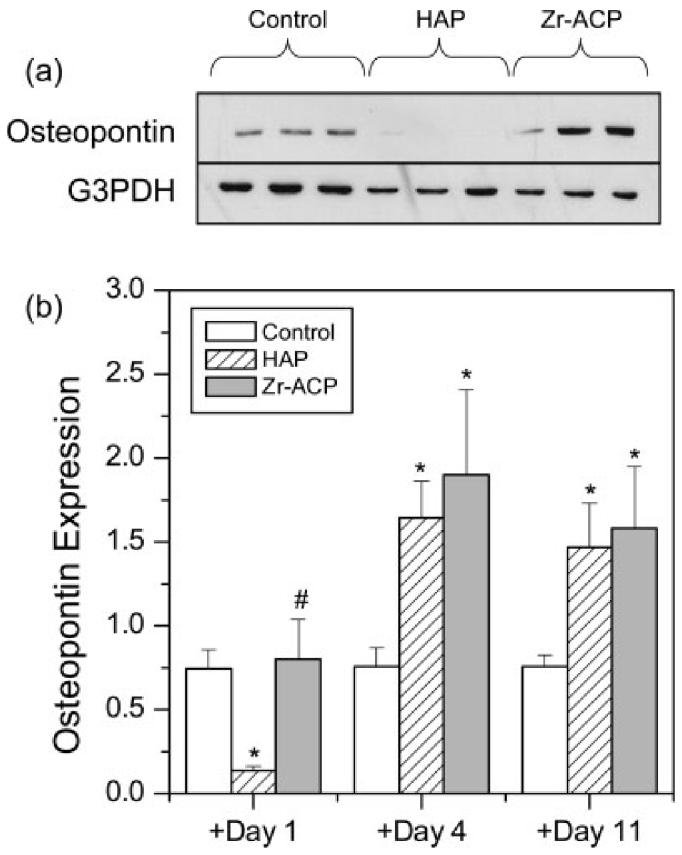
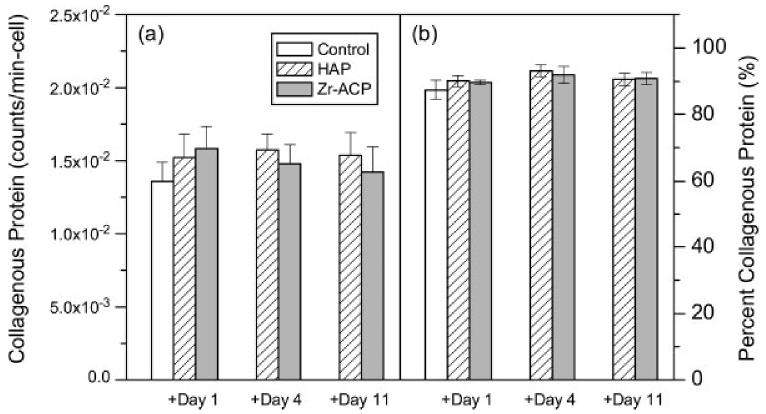
Calcium phosphate bioceramics, such as hydroxyapatite, have long been used as bone substitutes because of their proven biocompatibility and bone binding properties in vivo. Recently, a zirconia-hybridized pyrophosphate-stabilized amorphous calcium phosphate (Zr-ACP) has been synthesized, which is more soluble than hydroxyapatite and allows for controlled release of calcium and phosphate ions. These ions have been postulated to increase osteoblast differentiation and mineralization in vitro. The focus of this work is to elucidate the physicochemical properties of Zr-ACP and to measure cell response to Zr-ACP in vitro using a MC3T3-E1 mouse calvarial-derived osteoprogenitor cell line. Cells were cultured in osteogenic medium and mineral was added to culture at different stages in cell maturation. Culture in the presence of Zr-ACP showed significant increases in cell proliferation, alkaline phosphatase activity (ALP), and osteopontin (OPN) synthesis, whereas collagen synthesis was unaffected. In addition, calcium and phosphate ion concentrations and medium pH were found to transiently increase with the addition of Zr-ACP, and are hypothesized to be responsible for the osteogenic effect of Zr-ACP.
(c) 2005 Wiley Periodicals, Inc.
Figures
Similar articles
-
Fabrication and characterization of poly(DL-lactic-co-glycolic acid)/zirconia-hybridized amorphous calcium phosphate composites.J Biomater Sci Polym Ed. 2006;17(4):403-18. doi: 10.1163/156856206776374124. J Biomater Sci Polym Ed. 2006. PMID: 16768292 Free PMC article.
-
In vitro evaluation of osteoblastic differentiation on amorphous calcium phosphate-decorated poly(lactic-co-glycolic acid) scaffolds.J Tissue Eng Regen Med. 2011 Nov;5(10):780-9. doi: 10.1002/term.376. Epub 2010 Dec 29. J Tissue Eng Regen Med. 2011. PMID: 22002921
-
Novel ceramic bone replacement material Osbone® in a comparative in vitro study with osteoblasts.Clin Oral Implants Res. 2011 Jun;22(6):651-7. doi: 10.1111/j.1600-0501.2010.02015.x. Epub 2010 Oct 6. Clin Oral Implants Res. 2011. PMID: 21044164
-
Bone tissue engineering on patterned collagen films: an in vitro study.Biomaterials. 2005 May;26(14):1977-86. doi: 10.1016/j.biomaterials.2004.07.007. Biomaterials. 2005. PMID: 15576172
-
Bioactive behavior of silicon substituted calcium phosphate based bioceramics for bone regeneration.Mater Sci Eng C Mater Biol Appl. 2014 Feb 1;35:245-52. doi: 10.1016/j.msec.2013.11.013. Epub 2013 Nov 18. Mater Sci Eng C Mater Biol Appl. 2014. PMID: 24411375 Review.
Cited by
-
Bioactive calcium phosphate materials and applications in bone regeneration.Biomater Res. 2019 Jan 14;23:4. doi: 10.1186/s40824-018-0149-3. eCollection 2019. Biomater Res. 2019. PMID: 30675377 Free PMC article. Review.
-
Utility of Amorphous Calcium Phosphate-Based Scaffolds in Dental/Biomedical Applications.Biointerface Res Appl Chem. 2017;7(1):1989-1994. Epub 2017 Feb 15. Biointerface Res Appl Chem. 2017. PMID: 29225960 Free PMC article.
-
Fabrication and characterization of poly(DL-lactic-co-glycolic acid)/zirconia-hybridized amorphous calcium phosphate composites.J Biomater Sci Polym Ed. 2006;17(4):403-18. doi: 10.1163/156856206776374124. J Biomater Sci Polym Ed. 2006. PMID: 16768292 Free PMC article.
-
Pyrophosphate Stimulates Differentiation, Matrix Gene Expression and Alkaline Phosphatase Activity in Osteoblasts.PLoS One. 2016 Oct 4;11(10):e0163530. doi: 10.1371/journal.pone.0163530. eCollection 2016. PLoS One. 2016. PMID: 27701417 Free PMC article.
-
Effect of soluble zinc on differentiation of osteoprogenitor cells.J Biomed Mater Res A. 2007 Jun 1;81(3):766-9. doi: 10.1002/jbm.a.31214. J Biomed Mater Res A. 2007. PMID: 17377969 Free PMC article.
References
-
- Bohner M. Calcium orthophosphates in medicine: From ceramics to calcium phosphate cements. Injury. 2000;31(Suppl 4):37–47. - PubMed
-
- Eggli PS, Muller W, Schenk RK. Porous hydroxyapatite and tricalcium phosphate cylinders with two different pore size ranges implanted in the chancellors bone of rabbits. A comparative histomorphometric and histologic study of bony in-growth and implant substitution. Clin Orthop Relat Res. 1988;232:127–138. - PubMed
-
- Saffar JL, Colombier ML, Detienville R. Bone formation in tricalcium phosphate-filled periodontal intrabony lesions. Histological observations in humans. J Periodontol. 1990;61:209–216. - PubMed
-
- Schmitz JP, Hollinger JO, Milam SB. Reconstruction of bone using calcium phosphate bone cements: A critical review. J Oral Maxillofac Surg. 1999;57:1122–1126. - PubMed
-
- Goshima J, Goldberg VM, Caplan AI. Osteogenic potential of culture-expanded rat marrow cells as assayed in vivo with porous calcium phosphate ceramic. Biomaterials. 1991;12:253–258. - PubMed
Publication types
MeSH terms
Substances
Grants and funding
LinkOut - more resources
Full Text Sources
Research Materials
