

doi: 10.1111/j.1468-0009.2005.00398.x.
The epidemiologic transition: a theory of the epidemiology of population change. 1971
- PMID: 16279965
- PMCID: PMC2690264
- DOI: 10.1111/j.1468-0009.2005.00398.x
Item in Clipboard
The epidemiologic transition: a theory of the epidemiology of population change. 1971
Milbank Q.
2005.
No abstract available
Figures
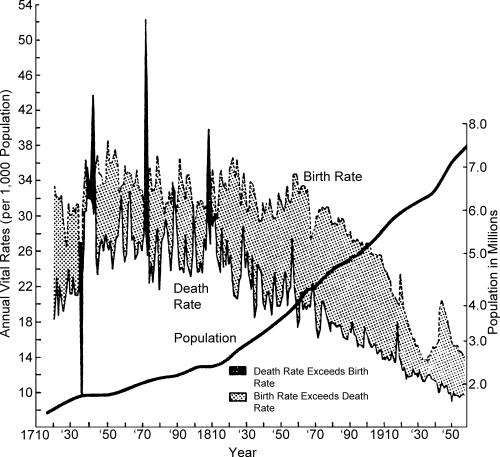
The Transition in Sweden Source: Vielrose, E. 1965. Elements of the Natural Movement of Populations. Oxford: Pergamon Press, Inc.
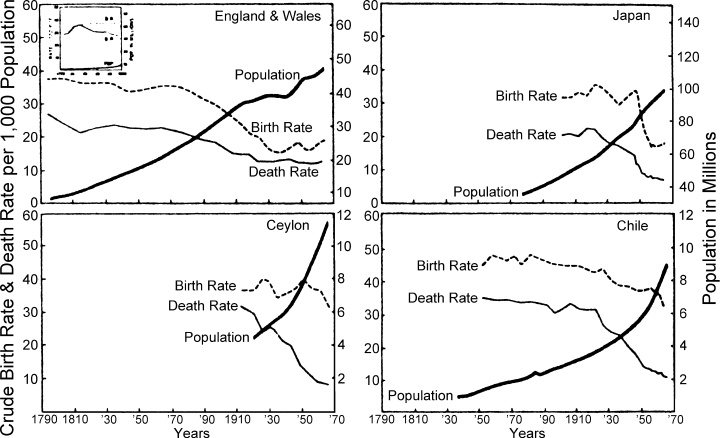
Demographic Trends in Selected Countries Sources: England and Wales eighteenth century data (inset) and early nineteenth century data (to 1841) are Brownlee's estimates, cited by Glass, D. V., Population and Population Movements in England and Wales, 1700 to 1850, in Glass, D. V. and Eversley, D. E. C. (Editors), Population in History, Chicago, Aldine Publishing Company, 1965, pp. 221–246; data for 1841–50 and 1951–55 are from Glass, D. and Grebenik, E., World Population, 1800–1950, in Habakkuk, H. J. and Postan, M. (Editors), The Cambridge Economic History of Europe, Vol. VI, Cambridge, Cambridge University Press, 1965, pp. 56–138; data since 1955 are from Demographic Yearbook, 1963 and Demographic Yearbook, 1967, New York, United Nations. Data for Japan, 1900–04 to 1958 are from Taeuber, I., Japan's Demographic Transition Re-examined, Population Studies, 14, 28–39, 1960–61; data since 1958 from Demographic Yearbook, op. cit. Data for Chile, 1850–54 to 1960–64, are from Collver, O. A., Birth Rates in Latin America: New Estimates of Historical Trends and Fluctuations, Research Series No. 7, Berkeley, Institute of International Studies, University of California, 1965; data since 1962 from Demographic Yearbook, 1967, op. cit. Data for Ceylon, 1911–13 to 1936 are from International Vital Statistics, Vital Statistics Special Reports, 9, May 2, 1940; 1936–38 to 1946 data from Annual Epidemiologic and Vital Statistics, 1939–1946. Geneva, World Health Organization, 1951; data since 1947 from Demographic Yearbook, 1953, 1963, and 1967, op. cit.
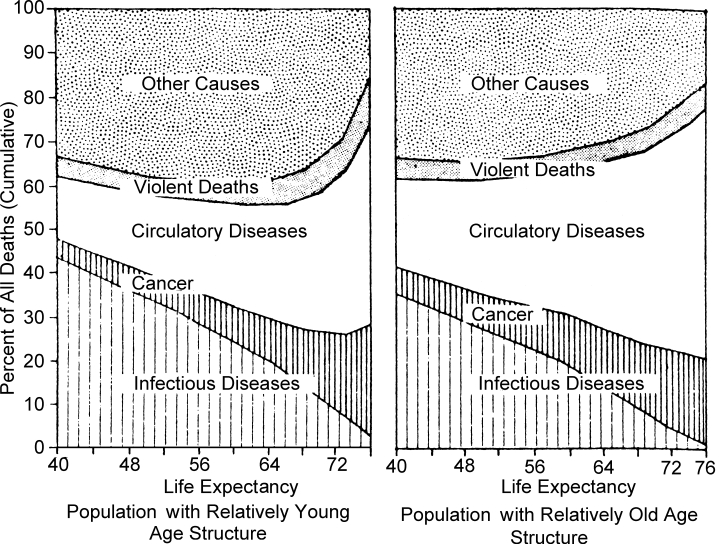
Pattern of Mortality Trends (Standardized Mortality) by Cause-of-Death Groups for Expectation of Life at Birth from 40 to 76 Years Source: Department of Economic and Social Affairs. 1962. Population Bulletin of the United Nations 6, 110–12.
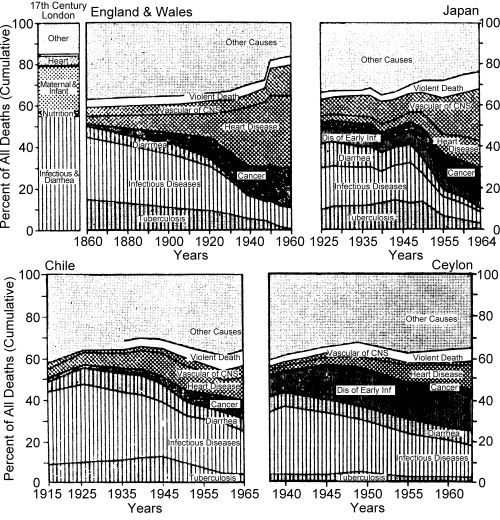
Trends in Cumulative Cause of Death Ratios for Both Sexes in Various Countries Sources: Data for seventeenth century London in Graunt, J., Natural and Political Observations Made upon the Bills of Mortality, Baltimore, The Johns Hopkins Press, 1939 (first published in London, 1662); data for England and Wales 1848 to 1947 from Logan, W. P. D., Mortality in England and Wales from 1848 to 1947, Population Studies, 4, 132–178, September 1950; data since 1947 from Annual Epidemiologic and Vital Statistics, 1960, Geneva, World Health Organization, 1963. Data for Japan, 1925 are from Report Prepared by the Central Sanitary Bureau of the Home Department, Tokyo, 1925; data for 1935 from International Vital Statistics, Vital Statistics Special Reports, 9, May 2, 1940; data for 1940, 1960 and 1964 are from Annual Epidemiologic and Vital Statistics, 1939–46, 1960 and 1964, op. cit.; data for 1947, 1950, 1955 and 1965 are from Demographic Yearbook, 1953, 1956 and 1967, New York, United Nations. Data for Chile, 1917 and 1926, are from Statistical Yearbook of the Republic of Chile, 1, 1926; data for 1936 are from Vital Statistics Special Reports, 1938; data for 1940–1955 are from Annual Epidemiologic and Vital Statistics, 1939–46, 1950 and 1956, op. cit.; data for 1960–65 are from Demographic Yearbook, 1966 and 1967, op. cit. Data for Ceylon, 1938–1960, are from Annual Epidemiologic and Vital Statistics, 1939–46, 1950, 1956 and 1960, op. cit.; data for 1963–65 are from Demographic Yearbook, 1963 and 1967, op. cit.
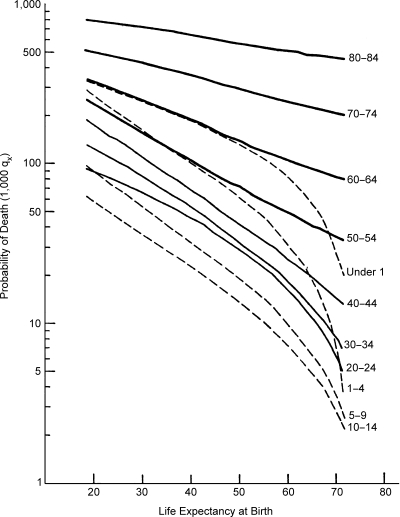
Trends in the Probability of Death (Life Table Mortality) for Age Groups with Increasing Life Expectancy at Birth (Both Sexes) Source: Department of Social Affairs, Population Branch, Age and Sex Patterns of Mortality: Model Life Tables for Underdeveloped Countries, Population Studies, No. 22, New York, United Nations, 1955.
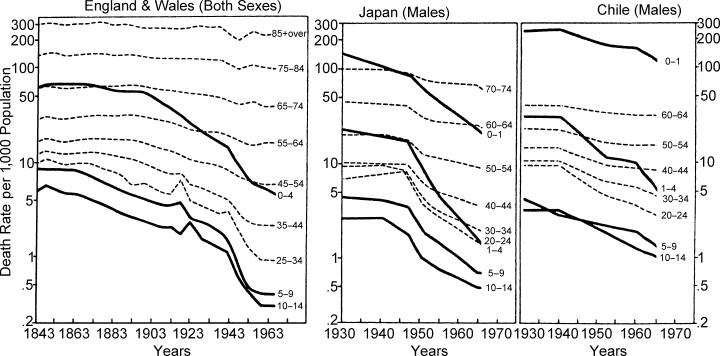
Trends in Age-Specific Death Rates in Various Countries (Semilogarithmic Scale) Sources: Data for 1841–45 to 1951–55 are from Vielrose, E., Elements of the Natural Movement of Populations, Oxford, Pergamon Press, Inc., 1965 and Demographic Yearbook, 1963 and 1967, New York, United Nations. Data for Japan, 1929–1948, are from Vital Statistics Special Reports, 1938; and Annual Epidemiologic and Vital Statistics, 1939–46, Geneva, World Health Organization; data for 1951–66 are from Demographic Yearbook, 1953 and 1967, op. cit. Data for Chile, 1930–32, are from Vital Statistics Special Reports, 1938; data for 1940–1965 are from Demographic Yearbook, 1953, 1966 and 1967, op. cit.
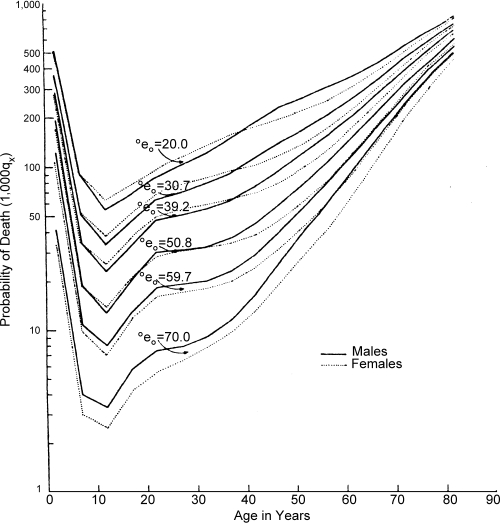
Probability of Death (1,000 qx) by Age and Sex at Various Levels of Life Expectancy at Birth Source: Department of Social Affairs, Population Branch, Age and Sex Patterns of Mortality: Model Life Tables for Underdeveloped Countries, Population Studies, No. 22, New York, United Nations, 1955.
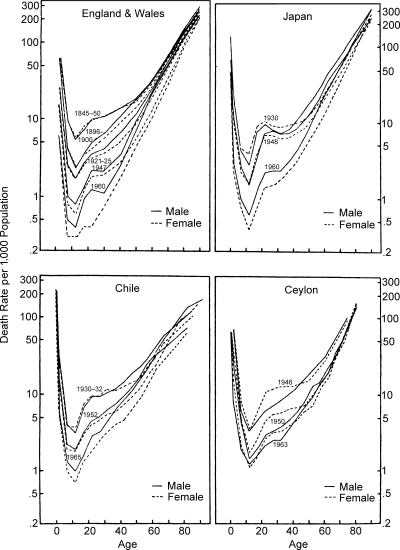
Trends in Age and Sex Profiles of Mortality in Various Countries (Semilogarithmic Scale) Sources: Data for England and Wales, Japan and Chile from same sources as in Figure 6. Data for Ceylon are from Demographic Yearbook, 1948, 1949–50, 1959, 1960 and 1965, New York, United Nations.
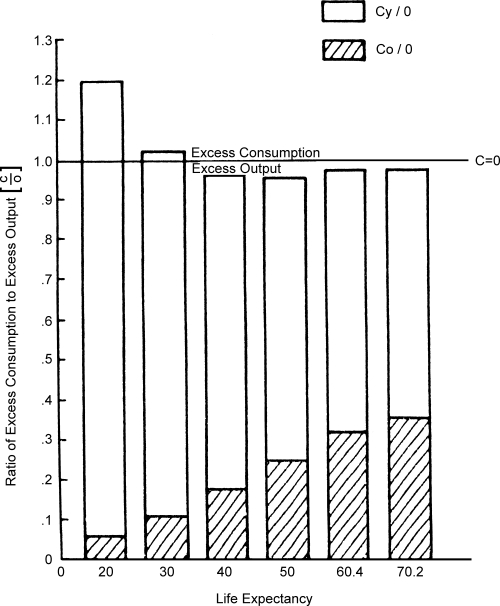
Relative Excesses in Consumption and Output for Stable Male Population at Various Life Expectancy Levels Sources: Calculated, as described in the text, using Department of Social Affairs, Population Branch, Age and Sex Patterns of Mortality: Model Life Tables for Underdeveloped Countries, Population Studies, No. 22, New York, United Nations, 1955: and Sauvy, A., General Theory of Population, New York, Basic Books, Inc., Publishers, 1969.
Republished from
-
The epidemiologic transition. A theory of the epidemiology of population change.Milbank Mem Fund Q. 1971 Oct;49(4):509-38. Milbank Mem Fund Q. 1971. PMID: 5155251 No abstract available.
References
-
- Angel, Pearson . In: World Population and Production: Trends and Outlook. Woytinsky WS, Woytinsky ES, editors. New York: Twentieth Century Fund; 1953. Cited in.
-
- Chambers JD. Glass and Eversley. Three Essays on the Population and Economy of the Midlands; pp. 308–53. op. cit.
-
- Department of Economic and Social Affairs. Population Bulletin of the United Nations. No. 6. New York: United Nations; 1962. pp. 110–12.
-
- Deprez P. Glass and Eversley. The Demographic Development of Flanders in the Eighteenth Century; pp. 608–30. op. cit.
-
- Drake M. Population and Society in Norway, 1735–1865. Cambridge, England: Cambridge University Press; 1969.
Publication types
MeSH terms
Personal name as subject
- Actions
LinkOut - more resources
Full Text Sources
