

Exploration of phylogenetic data using a global sequence analysis method
- PMID: 16280081
- PMCID: PMC1310607
- DOI: 10.1186/1471-2148-5-63
Exploration of phylogenetic data using a global sequence analysis method
Abstract
Background: Molecular phylogenetic methods are based on alignments of nucleic or peptidic sequences. The tremendous increase in molecular data permits phylogenetic analyses of very long sequences and of many species, but also requires methods to help manage large datasets.
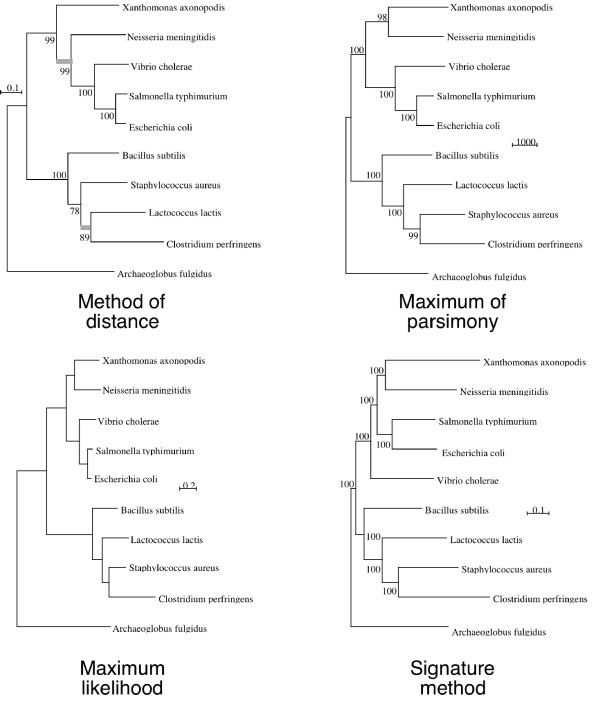
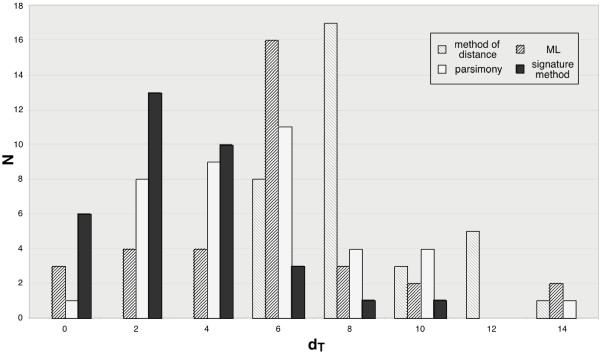
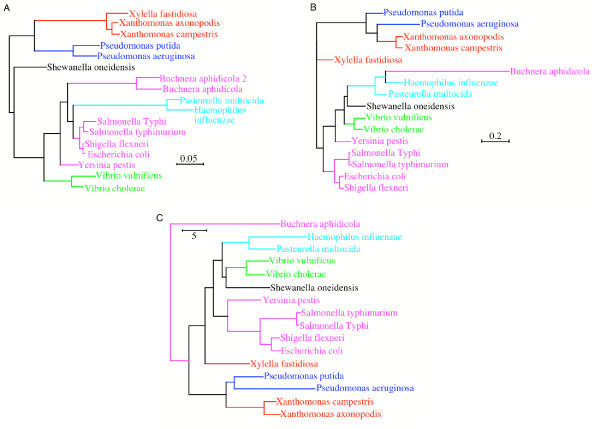
Results: Here we explore the phylogenetic signal present in molecular data by genomic signatures, defined as the set of frequencies of short oligonucleotides present in DNA sequences. Although violating many of the standard assumptions of traditional phylogenetic analyses--in particular explicit statements of homology inherent in character matrices--the use of the signature does permit the analysis of very long sequences, even those that are unalignable, and is therefore most useful in cases where alignment is questionable. We compare the results obtained by traditional phylogenetic methods to those inferred by the signature method for two genes: RAG1, which is easily alignable, and 18S RNA, where alignments are often ambiguous for some regions. We also apply this method to a multigene data set of 33 genes for 9 bacteria and one archea species as well as to the whole genome of a set of 16 gamma-proteobacteria. In addition to delivering phylogenetic results comparable to traditional methods, the comparison of signatures for the sequences involved in the bacterial example identified putative candidates for horizontal gene transfers.
Conclusion: The signature method is therefore a fast tool for exploring phylogenetic data, providing not only a pretreatment for discovering new sequence relationships, but also for identifying cases of sequence evolution that could confound traditional phylogenetic analysis.
Figures
Similar articles
-
RibAlign: a software tool and database for eubacterial phylogeny based on concatenated ribosomal protein subunits.BMC Bioinformatics. 2006 Feb 13;7:66. doi: 10.1186/1471-2105-7-66. BMC Bioinformatics. 2006. PMID: 16476165 Free PMC article.
-
SEPP: SATé-enabled phylogenetic placement.Pac Symp Biocomput. 2012:247-58. doi: 10.1142/9789814366496_0024. Pac Symp Biocomput. 2012. PMID: 22174280
-
Effects of nucleotide sequence alignment on phylogeny estimation: a case study of 18S rDNAs of apicomplexa.Mol Biol Evol. 1997 Apr;14(4):428-41. doi: 10.1093/oxfordjournals.molbev.a025779. Mol Biol Evol. 1997. PMID: 9100373
-
Phylogenetic inferences from molecular sequences: review and critique.Theor Popul Biol. 2001 Feb;59(1):27-40. doi: 10.1006/tpbi.2000.1485. Theor Popul Biol. 2001. PMID: 11243926 Review.
-
Tree disagreement: measuring and testing incongruence in phylogenies.J Biomed Inform. 2006 Feb;39(1):86-102. doi: 10.1016/j.jbi.2005.08.008. Epub 2005 Sep 28. J Biomed Inform. 2006. PMID: 16243006 Review.
Cited by
-
A convenient correspondence between k-mer-based metagenomic distances and phylogenetically-informed β-diversity measures.PLoS Comput Biol. 2023 Jan 6;19(1):e1010821. doi: 10.1371/journal.pcbi.1010821. eCollection 2023 Jan. PLoS Comput Biol. 2023. PMID: 36608056 Free PMC article.
-
Genomic Signature in Evolutionary Biology: A Review.Biology (Basel). 2023 Feb 16;12(2):322. doi: 10.3390/biology12020322. Biology (Basel). 2023. PMID: 36829597 Free PMC article. Review.
-
CAM: an alignment-free method to recover phylogenies using codon aversion motifs.PeerJ. 2019 Jun 4;7:e6984. doi: 10.7717/peerj.6984. eCollection 2019. PeerJ. 2019. PMID: 31198636 Free PMC article.
-
Phymm and PhymmBL: metagenomic phylogenetic classification with interpolated Markov models.Nat Methods. 2009 Sep;6(9):673-6. doi: 10.1038/nmeth.1358. Epub 2009 Aug 2. Nat Methods. 2009. PMID: 19648916 Free PMC article.
-
Evolution shapes and conserves genomic signatures in viruses.Commun Biol. 2024 Oct 30;7(1):1412. doi: 10.1038/s42003-024-07098-1. Commun Biol. 2024. PMID: 39478059 Free PMC article.
References
-
- Lecointre G, Le Guyader H. Classification phylogénétique du vivant. Paris, Belin; 2001. p. 544.
-
- Felsenstein J. Evolutionary trees from DNA sequences: a maximum likelihood approach. J Mol Evol. 1981;17:368–376. - PubMed
-
- Li WH. In: Molecular Evolution. Sinauer Sinauer A, editor. , Sinauer; 1997. p. 487.
-
- Higgins DG, Thompson JD, Gibson TJ. Using CLUSTAL for multiple sequence alignments. Methods Enzymol. 1996;266:383–402. - PubMed
-
- Brocchieri L. Phylogenetic inferences from molecular sequences: review and critique. Theor Popul Biol. 2001;59:27–40. - PubMed
Publication types
MeSH terms
Substances
LinkOut - more resources
Full Text Sources
