

ErmineJ: tool for functional analysis of gene expression data sets
- PMID: 16280084
- PMCID: PMC1310606
- DOI: 10.1186/1471-2105-6-269
ErmineJ: tool for functional analysis of gene expression data sets
Abstract
Background: It is common for the results of a microarray study to be analyzed in the context of biologically-motivated groups of genes such as pathways or Gene Ontology categories. The most common method for such analysis uses the hypergeometric distribution (or a related technique) to look for "over-representation" of groups among genes selected as being differentially expressed or otherwise of interest based on a gene-by-gene analysis. However, this method suffers from some limitations, and biologist-friendly tools that implement alternatives have not been reported.
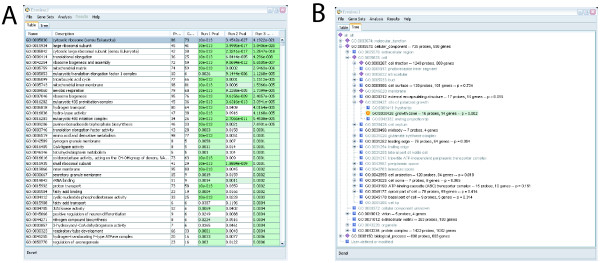
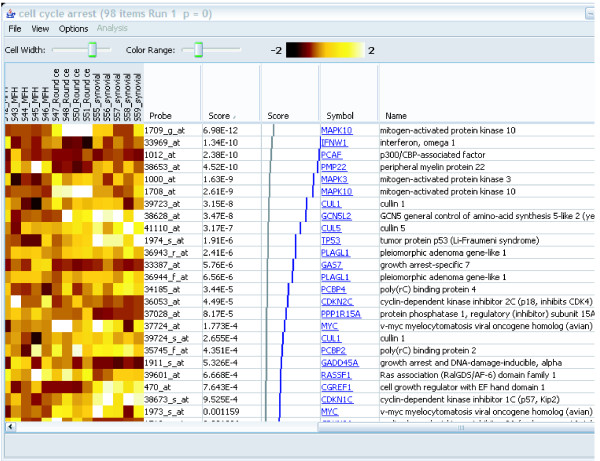
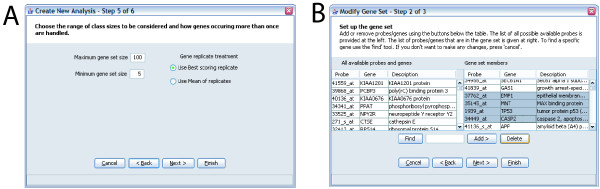
Results: We introduce ErmineJ, a multiplatform user-friendly stand-alone software tool for the analysis of functionally-relevant sets of genes in the context of microarray gene expression data. ErmineJ implements multiple algorithms for gene set analysis, including over-representation and resampling-based methods that focus on gene scores or correlation of gene expression profiles. In addition to a graphical user interface, ErmineJ has a command line interface and an application programming interface that can be used to automate analyses. The graphical user interface includes tools for creating and modifying gene sets, visualizing the Gene Ontology as a table or tree, and visualizing gene expression data. ErmineJ comes with a complete user manual, and is open-source software licensed under the Gnu Public License.
Conclusion: The availability of multiple analysis algorithms, together with a rich feature set and simple graphical interface, should make ErmineJ a useful addition to the biologist's informatics toolbox. ErmineJ is available from http://microarray.cu.genome.org.
Figures
References
-
- Ashburner M, Ball CA, Blake JA, Botstein D, Butler H, Cherry JM, Davis AP, Dolinski K, Dwight SS, Eppig JT, Harris MA, Hill DP, Issel-Tarver L, Kasarskis A, Lewis S, Matese JC, Richardson JE, Ringwald M, Rubin GM, Sherlock G. Gene ontology: tool for the unification of biology. The Gene Ontology Consortium. Nat Genet. 2000;25:25–29. doi: 10.1038/75556. - DOI - PMC - PubMed
-
- Gene Ontology Tools http://www.geneontology.org/GO.tools.shtml
-
- Pavlidis P, Lewis DP, Noble WS. Exploring gene expression data with class scores. Pac Symp Biocomput. 2002:474–485. - PubMed
MeSH terms
LinkOut - more resources
Full Text Sources
Other Literature Sources
