Comparative Study
. 2005 Nov 9;25(45):10420-36.
doi: 10.1523/JNEUROSCI.4684-04.2005.

Neural activity in macaque parietal cortex reflects temporal integration of visual motion signals during perceptual decision making

Affiliations
Comparative Study

Neural activity in macaque parietal cortex reflects temporal integration of visual motion signals during perceptual decision making

Alexander C Huk et al. J Neurosci. .

Abstract

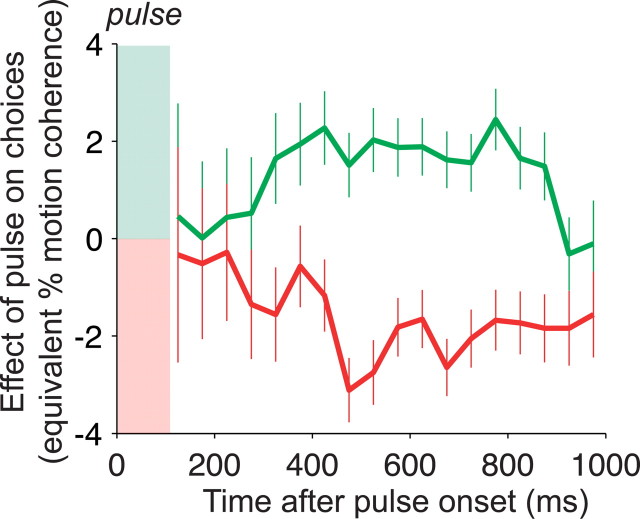
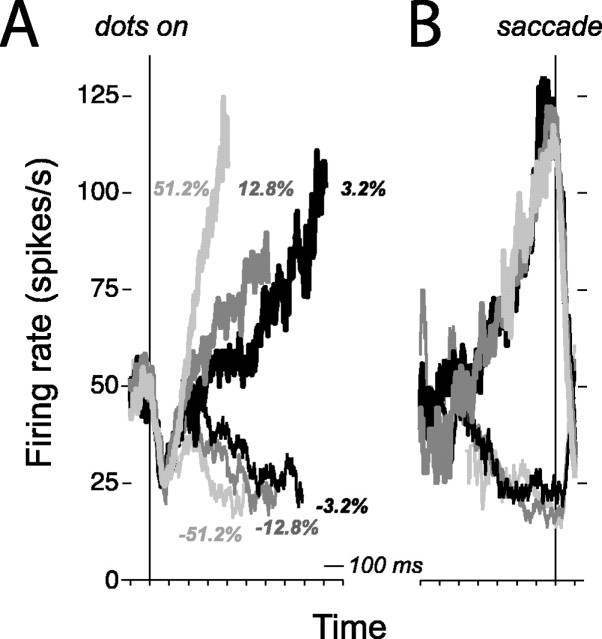
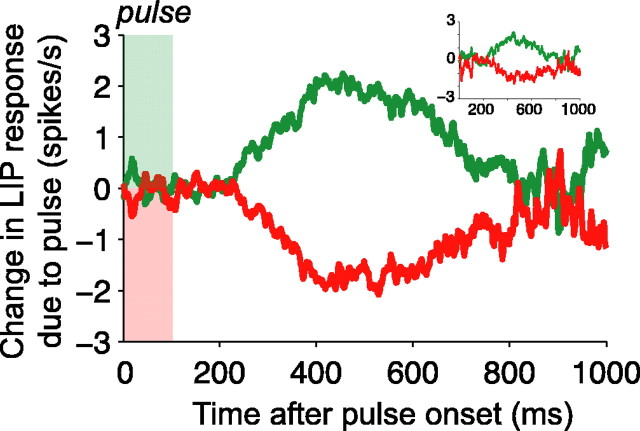
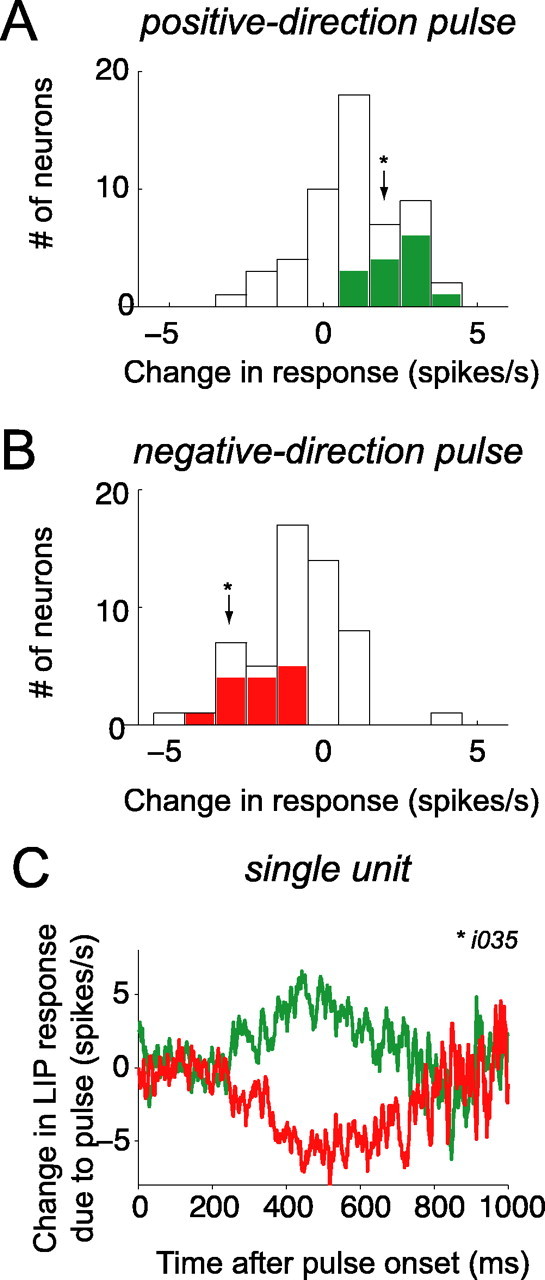
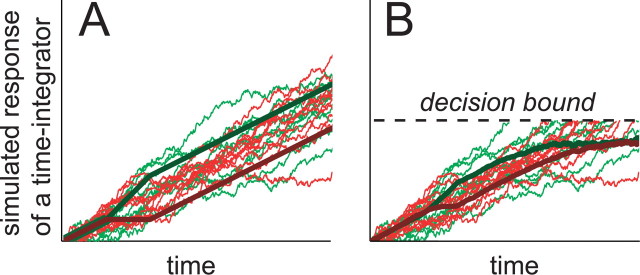
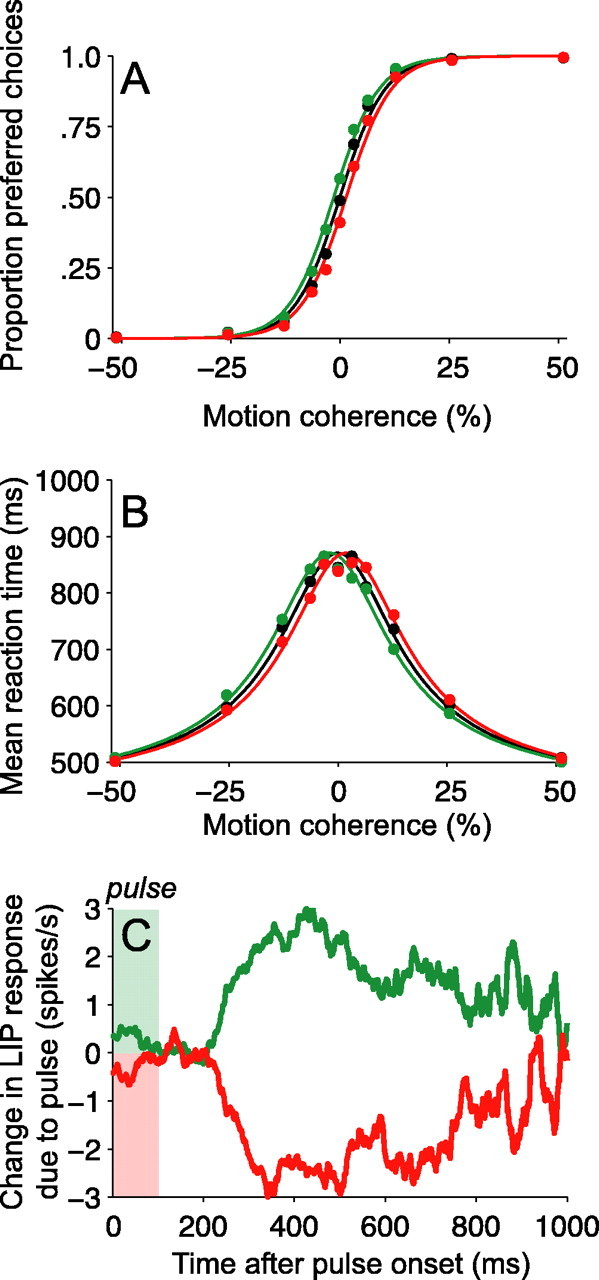
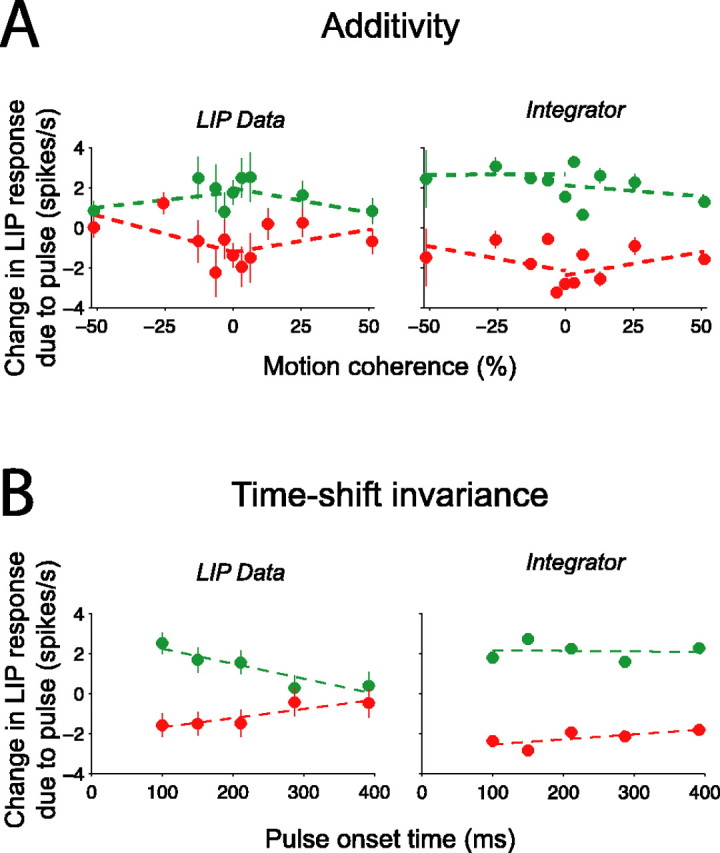
Decision-making often requires the accumulation and maintenance of evidence over time. Although the neural signals underlying sensory processing have been studied extensively, little is known about how the brain accrues and holds these sensory signals to guide later actions. Previous work has suggested that neural activity in the lateral intraparietal area (LIP) of the monkey brain reflects the formation of perceptual decisions in a random dot direction-discrimination task in which monkeys communicate their decisions with eye-movement responses. We tested the hypothesis that decision-related neural activity in LIP represents the time integral of the momentary motion "evidence." By briefly perturbing the strength of the visual motion stimulus during the formation of perceptual decisions, we tested whether this LIP activity reflected a persistent, integrated "memory" of these brief sensory events. We found that the responses of LIP neurons reflected substantial temporal integration. Brief pulses had persistent effects on both the monkeys' choices and the responses of neurons in LIP, lasting up to 800 ms after appearance. These results demonstrate that LIP is involved in neural time integration underlying the accumulation of evidence in this task. Additional analyses suggest that decision-related LIP responses, as well as behavioral choices and reaction times, can be explained by near-perfect time integration that stops when a criterion amount of evidence has been accumulated. Temporal integration may be a fundamental computation underlying higher cognitive functions that are dissociated from immediate sensory inputs or motor outputs.


Figures

Figure 1.
Figure 1.
Location of recording sites. Representative magnetic resonance images from one monkey show the recording cylinder positioned above the intraparietal sulcus (ips, arrowheads). Recordings were made from the lateral bank of the intraparietal sulcus in a region corresponding to ventral LIP by Lewis and Van Essen (2000). A, Coronal slice. B, Sagittal slice. Images were obtained using short T1 inversion recovery acquisition at 1.5 T using carotid radio-frequency coils placed adjacent to the head. Imaging voxel size was 0.47 × 0.47 mm square in plane, 3 mm thick.
Figure 2.
Figure 2.
Direction-discrimination task. A, Monkeys performed a two-alternative RT direction-discrimination task. After fixation, two choice targets appeared in the periphery. One of the targets was within the RF of the neuron, indicated by the shading. After a random delay, dynamic random dots motion appeared in a 5° diameter aperture. Both the strength of motion (percentage coherence) and direction were randomized from trial to trial. The monkey indicated a direction choice by making a saccadic eye movement to one of the choice targets. The motion stimulus was extinguished as soon as the gaze moved from the fixation point. The RT is the time from motion onset until saccade initiation. On all trials, the random dots were superimposed on a dim dynamic pixel noise texture background. On two-thirds of trials, the texture included a 100-ms-long motion pulse in either the same or the opposite direction of the random dot motion. The pulse occurred at one of five possible times after dots onset. B, Space-time (x-t) profile of the dynamic background texture. This is the time course of luminance across one row of pixels in the display. Note the orientation in x-t during the pulse (indicated by the bracket). The vertical (y) dimension of the texture is not shown. In any one video frame, the luminance values at each pixel in a vertical column are independent, random values drawn from a Gaussian distribution. The range of luminance actually used in the display was the lowest 10% of the overall range of the display. The random dots that were superimposed on the background were shown at 100% intensity. For additional details, see Materials and Methods. Example movies can be downloaded from http://www.shadlen.org/~mike/movies/pulse/.
Figure 3.
Figure 3.
Motion pulses affect decisions and reaction times. A, Psychometric functions. The proportion of preferred-target choices is plotted as a function of motion strength. Positive and negative motion strengths (values along the x-axis) indicate motion for and against preferred-target choices, respectively. The black points show the proportion of preferred choices when no motion pulse was present. The green (or red) points show the proportion of preferred choices on trials when a positive- (or negative-) direction motion pulse accompanied the random dot motion. Positive- (negative-) direction pulses increased (decreased) the probability of preferred-direction choices. The smooth curves are described by logistic functions (Eq. 6). The horizontal displacement of the colored curves equates the pulses with the addition or subtraction of 1.6% coherent motion to the random dots stimulus. B, Chronometric functions. Mean reaction time is plotted as a function of motion strength. Same format as in A. Positive-direction pulses sped up RTs for preferred-target choices and slowed down RTs for null-target choices (green points below black points for positive motion coherences; green points above black points for negative motion coherences; green curve shifted leftward). Negative-direction pulses exerted corresponding effects (red points and curves). The smooth curves are described by Equation 7. Positive-direction (or negative-direction) pulses shifted the chronometric function by an amount equivalent to adding (or subtracting) 1.6% coherent motion to the random dot display. Mean RTs shown reflect both correct and error trials; a similar pattern is evident for just correct responses. All curves in both panels are described by a single fit of Equations 6 and 7 to all points in both panels.
Figure 4.
Figure 4.
Persistent effect of motion pulses on decisions. The effect of positive and negative motion pulses on the monkeys' choices is shown as a function of the time interval from the motion pulse to the choice. Pulse effectiveness is quantified by the shift it induces in the psychometric function along the motion coherence axis. Positive values on the y-axis correspond to left shifts of the psychometric function (like the green curve in Fig. 3), equivalent to the addition of y% coherent motion to the random dot stimulus (negative values correspond to right shifts; red curve in Fig. 3). Trials were grouped in 75 ms bins according to their latency from onset of the background motion pulse to initiation of the eye movement response: RT minus pulse onset time. A psychometric function was fit to these data (effect of motion strength on choice; Eq. 8) and compared with a comparison group of no-pulse trials with matching range of RT. The effects of positive-direction and negative-direction pulses are given by β21 and β31, respectively (see Eq. 8). Error bars are SEs of the estimates of β2 and β3, also expressed in units of equivalent motion strength. Choices made up to 900 ms after a pulse were affected in a direction-selective manner.
Figure 5.
Figure 5.
LIP responses during performance of direction discrimination on stimuli with constant motion strength. Responses are averaged spike rates from a single, representative LIP neuron (i035). The traces are grouped by motion strength and the monkey's choice. Positive and negative motion strengths represent motion toward and away from the choice target in the response field of the neuron (thick and thin curves, respectively). Only correct choices are shown. A, Response averages are aligned to onset of random dot motion (left vertical line). Each trial contributes the early portion of its activity to the average: either up to 100 ms before the saccade or up to the median RT for the motion group, whichever occurs first. B, Response averages are aligned to initiation of the saccadic eye movement response (right vertical line). Each trial contributes the late portion of its activity to the average: either from 250 ms after onset of motion or the remaining amount of time corresponding to the median RT for that condition, whichever occurs last. The firing rate depends on motion strength during motion viewing and reaches a common level of activity preceding the eye movement response.
Figure 6.
Figure 6.
Temporal persistence of pulse effects on LIP responses. Graphs are averages of the pulse-induced change in firing rate as a function of time from pulse onset. The change in firing rate is estimated using the deviation of each trial from a template firing rate function. Template responses are averaged spike rates obtained from all trials sharing the same strength and direction of random dot motion and the same eye movement response (to the preferred- or null-choice target). Spike rates from single trials were calculated by convolution of the spike train with an α function (τrise = 1 ms, τdecay = 25 ms; see Materials and Methods). These spike rates were used to compute both the templates and pulse-induced deviations. The deviations were aligned in time to the onset of the motion pulse and then averaged to produce the graph shown. The green and red curves show the deviation caused by positive- and negative-direction pulses, respectively, averaged over all motion strengths and directions. Pulse effects were evident from 225-800 ms after onset (n = 54 neurons from 2 monkeys, 55,014 trials total). The inset (top right) shows the pulse effect only for trials with RTs that occurred at least 750 ms after the onset of the pulse. Note that the latency and time course of the pulse effects are similar that shown in the main graph.
Figure 7.
Figure 7.
Population summary of motion pulse effects on LIP activity. For each neuron, the pulse-induced change in firing rate was averaged over the 225-800 ms epoch after pulse onset. A, Frequency histogram of pulse-induced change in firing rate after positive-direction pulses. Positive-direction pulses increase LIP activity. Neurons with individually significant pulse effects are shaded (positive-direction pulse > negative-direction pulse; t test, p < 0.05). Arrowhead indicates the change in firing rate from the sample neuron (i034) shown in C. B, Frequency histogram of pulse-induced change in firing rate after negative-direction pulses. Negative-direction pulses decrease LIP activity. Same format as A (n = 54 neurons). C, Temporal persistence of pulse effects on responses of a single LIP neuron. Pulse effects seen in this neuron (i034) were similar to that observed in the population (same format as Fig. 6; note that the time course of the population average pulse effect shown in Fig. 6 was not affected by removal of this unit from the population).
Figure 8.
Figure 8.
Presence of a decision bound limits the apparent degree of temporal persistence of pulse effects. Integration of noisy sensory signals can be described as a random walk or diffusion process. The thin traces in both panels show sample trajectories of such diffusion processes. They depict the accumulated sensory evidence associated with repeated trials using a relatively strong positive motion. The sensory signal gives rise to a sequence of random numbers drawn from a Gaussian distribution with mean μ (σ2t). After 100 ms, the mean changes to μ±Δμ for 100 ms and then returns to μ. Each trace is the time integral of such a sequence of random numbers (green, +Δμ mimicking a positive-direction pulse; red, -Δμ mimicking a negative-direction pulse). The time integrals are themselves perfect: they do not introduce additional noise and there is no decay. Averages of these trajectories are shown by the thick lines. A, Unbounded case. The mean trajectories are straight lines with slope = μ, which is perturbed momentarily by ±Δμ. Under the assumption of perfect integration, the mean trajectories remain separated for all t. B, Bounded case. The mean trajectories begin as in A, but they approach an upper bound. The perturbation still causes a separation of the averaged trajectories, but this separation diminishes over time.
Figure 9.
Figure 9.
Simulated perfect integrator accounts for choices, RTs, and LIP activity. Results of simulations of a three-stage model. Stage 1 contains two pools of direction-selective neurons with properties like neurons in area MT. The pools prefer motion in the positive and negative directions, respectively. Their firing rates are proportional to motion coherence plus a constant plus noise, delayed by 100 ms relative to the motion stimulus. Stage 2 contains two pools of neurons, which are hypothesized to bear the following similarity to LIP neurons described in this paper. Their spike rates represent the integral of the difference in spike rates from opposing pools of the simulated MT neurons, delayed by 125 ms relative to the MT response. The pools integrate evidence for/against and against/for the positive direction of motion. Stage 3 is a threshold crossing detection that terminates the decision when the average response of one of the stage 2 pools reaches a bound. The pool reaching the bound first governs the choice; the behavioral response is initiated ∼150 ms later. Note that the averaging described above is over neurons in the pool, not over time. A, B, Calibration of the model using the behavioral results. Filled points show the same data as in Figure 3. The solid curves are averages from model simulations. The expected firing rates of stage 1 neurons to positive and negative motion were adjusted, along with the height of the decision bound in stage 3, to approximate the psychometric and chronometric functions on trials without motion pulses (black curves in A, B). The expected change in stage 1 firing rates accompanying the 100 ms background pulses was adjusted to approximate the observed shifts in choice and RT associated with positive- and negative-direction pulses (green and red curves, respectively). C, Model predictions for stage 2 neurons. The calibrated model was used to simulate the experiment, using the same motion strengths, directions, pulses, pulse times, and number of trials. The simulated responses (spikes) from stage 2 neurons were analyzed in the same way as the neural data (see Fig. 6). Positive-direction pulses induced positive deviations in spike rate from stage 2 neurons (red curve). Negative-direction pulses induced negative deviations in spike rate. The magnitude and time course of the pulse-induced deviations of stage 2 neurons is similar to real LIP neurons (Fig. 6).
Figure 10.
Figure 10.
Analysis of additivity and time-shift invariance of LIP responses. A, Brief background pulses add or subtract a nearly constant offset to the LIP firing rate, regardless of the strength of random dot motion. The pulse-induced change in firing rate was measured in the epoch from 250 to 350 ms, using only the earliest pulse onset time (100 ms). The change in LIP firing rate is plotted as a function of the strength of random dot motion to which it was added (left). The same analysis was applied to simulated LIP responses (right), and a similar relationship between pulse effect and motion coherence was observed. Green points and lines, Positive-direction pulses; red points and lines, negative-direction pulses. Displayed regression lines were fit independently to each pulse and dot direction (4 total); statistics were computed on the results of a combined fit (Eq. 9). B, Background pulses add or subtract less when they occur later during motion viewing. The pulse-induced change in firing rate was measured in the epoch from 250 to 350 ms, separated by the onset time of the pulse. The change in LIP firing rate is plotted as a function of pulse onset time (left). Later pulses exerted weaker effects than earlier pulses. The same analysis was applied to simulated LIP responses (right). The decline of pulse effects with onset time in this model integrator is less steep than in the LIP data. Displayed regression lines were fit independently to each pulse direction; statistics were computed on the results of a combined fit (Eq. 10). Green points and regression lines, Positive-direction pulses; red points and lines, negative-direction pulses.

Similar articles

Cited by

References

    1. Adelson EH, Bergen JR (1985) Spatio-temporal energy models for the perception of motion. J Opt Soc Am A 2: 284-299. - PubMed
    1. Aksay E, Gamkrelidze G, Seung HS, Baker R, Tank DW (2001) In vivo intracellular recording and perturbation of persistent activity in a neural integrator. Nat Neurosci 4: 184-193. - PubMed
    1. Arnold DB, Robinson DA (1991) A learning network model of the neural integrator of the oculomotor system. Biol Cybern 64: 447-454. - PubMed
    1. Audley RJ, Pike AR (1965) Some alternative stochastic models of choice. Br J Math Stat Psychol 18: 207-255.
    1. Bair W, Movshon JA (2004) Adaptive temporal integration of motion in direction-selective neurons in macaque visual cortex. J Neurosci 24: 7305-7323. - PMC - PubMed

Publication types

MeSH terms

LinkOut - more resources