Identifying human parieto-insular vestibular cortex using fMRI and cytoarchitectonic mapping
- PMID: 16281284
- PMCID: PMC6871353
- DOI: 10.1002/hbm.20205
Identifying human parieto-insular vestibular cortex using fMRI and cytoarchitectonic mapping
Abstract
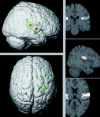
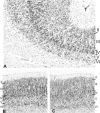
The parieto-insular vestibular cortex (PIVC) plays a central role in the cortical vestibular network. Although this region was first defined and subsequently extensively studied in nonhuman primates, there is also ample evidence for a human analogue in the posterior parietal operculum. In this study, we functionally and anatomically characterize the putative human equivalent to macaque area PIVC by combining functional magnetic resonance imaging (fMRI) of the cortical response to galvanic vestibular stimulation (GVS) with probabilistic cytoarchitectonic maps of the human parietal operculum. Our fMRI data revealed a bilateral cortical response to GVS in posterior parieto-insular cortex. Based on the topographic similarity of these activations to primate area PIVC, we suggest that they constitute the functionally defined human equivalent to macaque area PIVC. The locations of these activations were then compared to the probabilistic cytoarchitectonic maps of the parietal operculum (Eickhoff et al. [2005a]: Cereb Cortex, in press; Eickhoff et al. [2005c]: Cereb Cortex, in press), whereby the functionally defined PIVC matched most closely the cytoarchitectonically defined area OP 2. This activation of OP 2 by vestibular stimulation and its cytoarchitectonic features, which are similar to other primary sensory areas, suggest that area OP 2 constitutes the human equivalent of macaque area PIVC.
The parieto‐insular vestibular cortex (PIVC) plays a central role in the cortical vestibular network. Although this region was first defined and subsequently extensively studied in nonhuman primates, there is also ample evidence for a human analogue in the posterior parietal operculum. In this study, we functionally and anatomically characterize the putative human equivalent to macaque area PIVC by combining functional magnetic resonance imaging (fMRI) of the cortical response to galvanic vestibular stimulation (GVS) with probabilistic cytoarchitectonic maps of the human parietal operculum. Our fMRI data revealed a bilateral cortical response to GVS in posterior parieto‐insular cortex. Based on the topographic similarity of these activations to primate area PIVC, we suggest that they constitute the functionally defined human equivalent to macaque area PIVC. The locations of these activations were then compared to the probabilistic cytoarchitectonic maps of the parietal operculum (Eickhoff et al. [2005a]: Cereb Cortex, in press; Eickhoff et al. [2005c]: Cereb Cortex, in press), whereby the functionally defined PIVC matched most closely the cytoarchitectonically defined area OP 2. This activation of OP 2 by vestibular stimulation and its cytoarchitectonic features, which are similar to other primary sensory areas, suggest that area OP 2 constitutes the human equivalent of macaque area PIVC. Hum Brain Mapp, 2005. © 2005 Wiley‐Liss, Inc.
2005 Wiley-Liss, Inc.
Figures


Similar articles
-
Macaque parieto-insular vestibular cortex: responses to self-motion and optic flow.J Neurosci. 2010 Feb 24;30(8):3022-42. doi: 10.1523/JNEUROSCI.4029-09.2010. J Neurosci. 2010. PMID: 20181599 Free PMC article.
-
The parieto-insular vestibular cortex in humans: more than a single area?J Neurophysiol. 2018 Sep 1;120(3):1438-1450. doi: 10.1152/jn.00907.2017. Epub 2018 Jul 11. J Neurophysiol. 2018. PMID: 29995604 Review.
-
Dynamics of Heading and Choice-Related Signals in the Parieto-Insular Vestibular Cortex of Macaque Monkeys.J Neurosci. 2021 Apr 7;41(14):3254-3265. doi: 10.1523/JNEUROSCI.2275-20.2021. Epub 2021 Feb 23. J Neurosci. 2021. PMID: 33622780 Free PMC article.
-
Cortico-cortical connections and cytoarchitectonics of the primate vestibular cortex: a study in squirrel monkeys (Saimiri sciureus).J Comp Neurol. 1992 Dec 15;326(3):375-401. doi: 10.1002/cne.903260306. J Comp Neurol. 1992. PMID: 1281845
-
The vestibular cortex. Its locations, functions, and disorders.Ann N Y Acad Sci. 1999 May 28;871:293-312. doi: 10.1111/j.1749-6632.1999.tb09193.x. Ann N Y Acad Sci. 1999. PMID: 10372080 Review.
Cited by
-
Early and phasic cortical metabolic changes in vestibular neuritis onset.PLoS One. 2013;8(3):e57596. doi: 10.1371/journal.pone.0057596. Epub 2013 Mar 7. PLoS One. 2013. PMID: 23505435 Free PMC article.
-
The human vestibular cortex: functional anatomy of OP2, its connectivity and the effect of vestibular disease.Cereb Cortex. 2023 Jan 5;33(3):567-582. doi: 10.1093/cercor/bhac085. Cereb Cortex. 2023. PMID: 35235642 Free PMC article.
-
Robust brain parcellation using sparse representation on resting-state fMRI.Brain Struct Funct. 2015 Nov;220(6):3565-79. doi: 10.1007/s00429-014-0874-x. Epub 2014 Aug 26. Brain Struct Funct. 2015. PMID: 25156576 Free PMC article.
-
Mal de debarquement.Semin Neurol. 2009 Nov;29(5):520-7. doi: 10.1055/s-0029-1241038. Epub 2009 Oct 15. Semin Neurol. 2009. PMID: 19834863 Free PMC article. Review.
-
Altered thalamus functional connectivity in patients with acute unilateral vestibulopathy: a resting-state fMRI study.Front Neurosci. 2024 Jul 1;18:1388213. doi: 10.3389/fnins.2024.1388213. eCollection 2024. Front Neurosci. 2024. PMID: 39010942 Free PMC article.
References
-
- Akbarian S, Berndl K, Grusser OJ, Guldin W, Pause M, Schreiter U (1988): Responses of single neurons in the parietoinsular vestibular cortex of primates. Ann N Y Acad Sci 545: 187–202. - PubMed
-
- Akbarian S, Grusser OJ, Guldin WO (1994): Corticofugal connections between the cerebral cortex and brainstem vestibular nuclei in the macaque monkey. J Comp Neurol 339: 421–437. - PubMed
-
- Amunts K, Malikovic A, Mohlberg H, Schormann T, Zilles K (2000): Brodmann's areas 17 and 18 brought into stereotaxic space—where and how variable? Neuroimage 11: 66–84. - PubMed
-
- Ashburner J, Friston KJ (2003a): High‐dimensional image warping In: Zeki S, Ashburner JT, Penny WD, Frackowiak RSJ, Friston KJ, Frith CD, Dolan RJ, Price CJ, editors. Human brain function. Oxford: Academic Press; p 673–694.
-
- Ashburner J, Friston KJ (2003b): Rigid body registration In: Zeki S, Ashburner JT, Penny WD, Frackowiak RSJ, Friston KJ, Frith CD, Dolan RJ, Price CJ, editors. Human brain function. Oxford: Academic Press; p 635–653.
Publication types
MeSH terms
LinkOut - more resources
Full Text Sources
Miscellaneous

