Tail muscles become slow but fatigable in chronic sacral spinal rats with spasticity
- PMID: 16282205
- PMCID: PMC5726403
- DOI: 10.1152/jn.00456.2005
Tail muscles become slow but fatigable in chronic sacral spinal rats with spasticity
Abstract
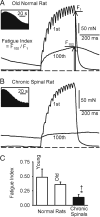
Paralyzed skeletal muscle sometimes becomes faster and more fatigable after spinal cord injury (SCI) because of reduced activity. However, in some cases, pronounced muscle activity in the form of spasticity (hyperreflexia and hypertonus) occurs after long-term SCI. We hypothesized that this spastic activity may be associated with a reversal back to a slower, less fatigable muscle. In adult rats, a sacral (S2) spinal cord transection was performed, affecting only tail musculature and resulting in chronic tail spasticity beginning 2 wk later and lasting indefinitely. At 8 mo after injury, we examined the contractile properties of the segmental tail muscle in anesthetized spastic rats and in age-matched normal rats. The segmental tail muscle has only a few motor units (<12), which were easily detected with graded nerve stimulation, revealing two clear motor unit twitch durations. The dominant faster unit twitches peaked at 15 ms and ended within 50 ms, whereas the slower unit twitches only peaked at 30-50 ms. With chronic injury, this slow twitch component increased, resulting in a large overall increase (>150%) in the fraction of the peak muscle twitch force remaining at 50 ms. With injury, the peak muscle twitch (evoked with supramaximal stimulation) also increased in its time to peak (+48.9%) and half-rise time (+150.0%), and decreased in its maximum rise (-35.0%) and decay rates (-40.1%). Likewise, after a tetanic stimulation, the tetanus half-fall time increased by 53.8%. Therefore the slow portion of the muscle was enhanced in spastic muscles. Consistent with slowing, posttetanic potentiation was 9.2% lower and the stimulation frequency required to produce half-maximal tetanus decreased 39.0% in chronic spinals. Interestingly, in spastic muscles compared with normal, whole muscle twitch force was 81.1% higher, whereas tetanic force production was 38.1% lower. Hence the twitch-to-tetanus ratio increased 104.0%. Inconsistent with overall slowing, whole spastic muscles were 61.5% more fatigable than normal muscles. Thus contrary to the classical slow-to-fast conversion that is seen after SCI without spasticity, SCI with spasticity is associated with a mixed effect, including a preservation/enhancement of slow properties, but a loss of fatigue resistance.
Figures


Similar articles
-
Spastic tail muscles recover from myofiber atrophy and myosin heavy chain transformations in chronic spinal rats.J Neurophysiol. 2007 Feb;97(2):1040-51. doi: 10.1152/jn.00622.2006. Epub 2006 Nov 22. J Neurophysiol. 2007. PMID: 17122320 Free PMC article.
-
Spastic long-lasting reflexes in the awake rat after sacral spinal cord injury.J Neurophysiol. 2004 May;91(5):2247-58. doi: 10.1152/jn.00946.2003. J Neurophysiol. 2004. PMID: 15069102
-
Changes in contractile properties of motor units of the rat medial gastrocnemius muscle after spinal cord transection.Exp Physiol. 2006 Sep;91(5):887-95. doi: 10.1113/expphysiol.2005.033076. Epub 2006 May 25. Exp Physiol. 2006. PMID: 16728457
-
Human spinal cord injury: motor unit properties and behaviour.Acta Physiol (Oxf). 2014 Jan;210(1):5-19. doi: 10.1111/apha.12153. Epub 2013 Sep 13. Acta Physiol (Oxf). 2014. PMID: 23901835 Review.
-
Muscle characteristics and fatigue properties after spinal cord injury.Crit Rev Biomed Eng. 2009;37(1-2):139-64. doi: 10.1615/critrevbiomedeng.v37.i1-2.40. Crit Rev Biomed Eng. 2009. PMID: 20201773 Review.
Cited by
-
Motoneuron afterhyperpolarisation duration in amyotrophic lateral sclerosis.J Physiol. 2011 Jun 1;589(Pt 11):2745-54. doi: 10.1113/jphysiol.2011.204891. Epub 2011 Mar 28. J Physiol. 2011. PMID: 21486815 Free PMC article. Clinical Trial.
-
Postfatigue potentiation of the paralyzed soleus muscle: evidence for adaptation with long-term electrical stimulation training.J Appl Physiol (1985). 2006 Aug;101(2):556-65. doi: 10.1152/japplphysiol.00099.2006. Epub 2006 Mar 30. J Appl Physiol (1985). 2006. PMID: 16575026 Free PMC article. Clinical Trial.
-
Neuronal involvement in muscular atrophy.Front Cell Neurosci. 2014 Dec 10;8:405. doi: 10.3389/fncel.2014.00405. eCollection 2014. Front Cell Neurosci. 2014. PMID: 25540609 Free PMC article. Review.
-
Recovery of neuronal and network excitability after spinal cord injury and implications for spasticity.Front Integr Neurosci. 2014 May 12;8:36. doi: 10.3389/fnint.2014.00036. eCollection 2014. Front Integr Neurosci. 2014. PMID: 24860447 Free PMC article. Review.
-
Glycine and N-Acetylcysteine (GlyNAC) Combined with Body Weight Support Treadmill Training Improved Spinal Cord and Skeletal Muscle Structure and Function in Rats with Spinal Cord Injury.Nutrients. 2023 Oct 28;15(21):4578. doi: 10.3390/nu15214578. Nutrients. 2023. PMID: 37960231 Free PMC article.
References
-
- Ansved T, Larsson L. Effects of ageing on enzyme-histochemical, morphometrical and contractile properties of the soleus muscle in the rat. J Neurol Sci. 1989;93:105–124. - PubMed
-
- Bennett DJ, Gorassini M, Fouad K, Sanelli L, Han Y, Cheng J. Spasticity in rats with sacral spinal cord injury. JNeurotrauma. 1999;16:69–84. - PubMed
-
- Bennett DJ, Li Y, Harvey PJ, Gorassini M. Evidence for plateau potentials in tail motoneurons of awake chronic spinal rats with spasticity. J Neurophysiol. 2001;86:1972–1982. - PubMed
Publication types
MeSH terms
Grants and funding
LinkOut - more resources
Full Text Sources
Medical

