. 2006 Jan;7(1):46-51.
doi: 10.1038/sj.embor.7400560.

Live-cell imaging of endogenous Ras-GTP illustrates predominant Ras activation at the plasma membrane

Affiliations

Live-cell imaging of endogenous Ras-GTP illustrates predominant Ras activation at the plasma membrane

Martin Augsten et al. EMBO Rep. 2006 Jan.

Abstract

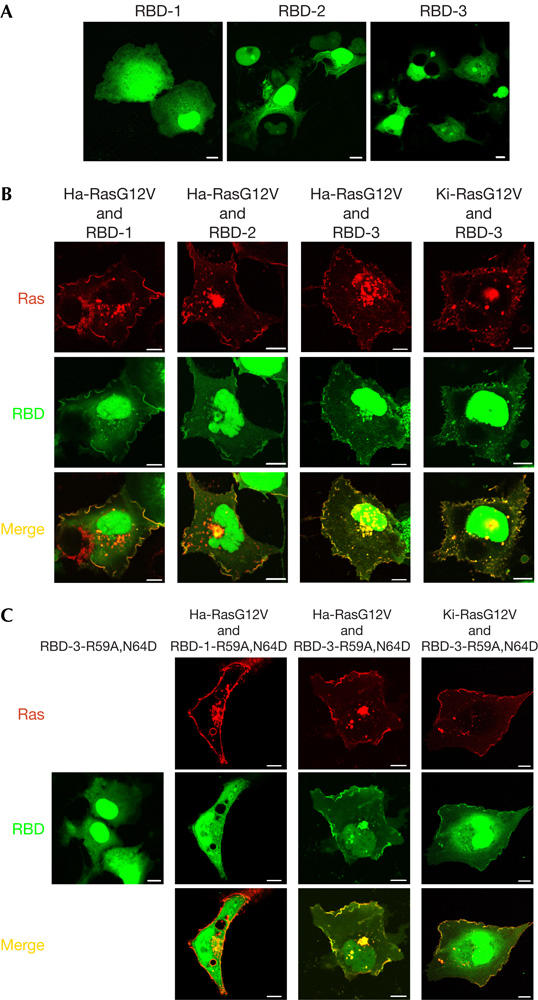
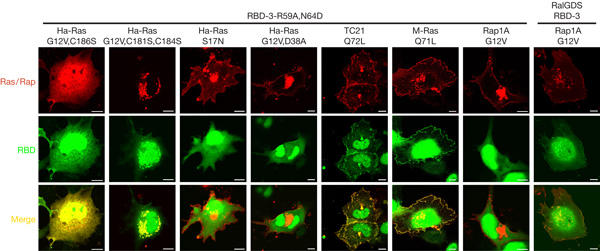
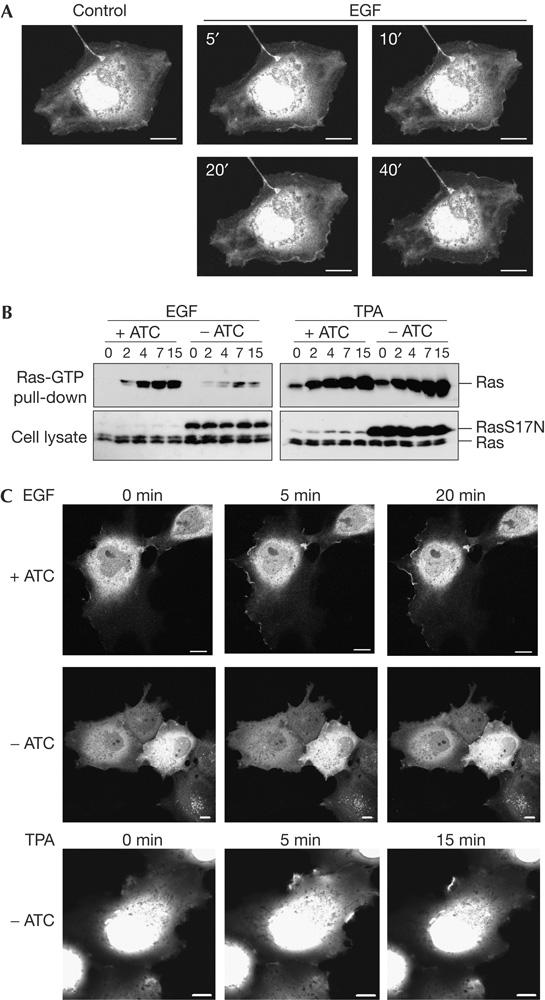
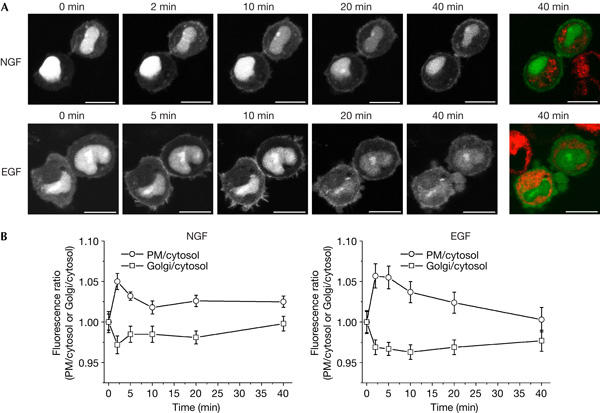
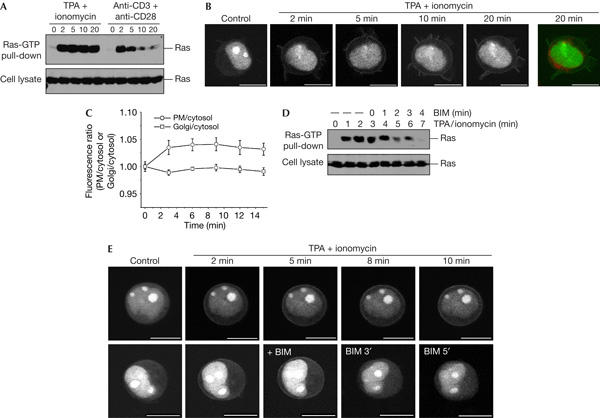
Ras-GTP imaging studies using the Ras-binding domain (RBD) of the Ras effector c-Raf as a reporter for overexpressed Ras have produced discrepant results about the possible activation of Ras at the Golgi apparatus. We report that RBD oligomerization provides probes for visualization of endogenous Ras-GTP, obviating Ras overexpression and the side effects derived thereof. RBD oligomerization results in tenacious binding to Ras-GTP and interruption of Ras signalling. Trimeric RBD probes fused to green fluorescent protein report agonist-induced endogenous Ras activation at the plasma membrane (PM) of COS-7, PC12 and Jurkat cells, but do not accumulate at the Golgi. PM illumination is exacerbated by Ras overexpression and its sensitivity to dominant-negative RasS17N and pharmacological manipulations matches Ras-GTP formation assessed biochemically. Our data illustrate that endogenous Golgi-located Ras is not under the control of growth factors and argue for the PM as the predominant site of agonist-induced Ras activation.


Figures

Figure 1
Figure 1
Cellular effects and distribution of oligomerized RBD polypeptides. (A) Distribution of GFP–RBD-1/2/3 in serum-starved COS-7 cells. More than 90% of transfected cells showed the described phenotype. GFP, green fluorescent protein; RBD, Ras-binding domain of the Ras effector c-Raf. (B) COS-7 cells were transfected with DsRed-tagged Ha-RasG12V or Ki-RasG12V in combination with GFP–RBD-1/2/3, as indicated. Cells were serum starved and imaged alive. Yellow pseudo-colour marks colocalization. (C) GFP–RBD-1-R59A,N64D or GFP–RBD-3-R59A,N64D was co-transfected with DsRed-Ha-RasG12V or DsRed-Ki-RasG12V, as indicated. Protein distribution was imaged confocally. Scale bars, 10 μm.
Figure 2
Figure 2
Specificity of GFP–RBD-3-R59A,N64D as a reporter for Ras-GTP. COS-7 cells were transfected with GFP–RBD-3-R59A,N64D or GFP–RalGDS-RBD-3 in combination with the indicated DsRed-tagged GTPases. Cells were imaged confocally. GFP, green fluorescent protein; RBD, Ras-binding domain of the Ras effector c-Raf. Scale bars, 10 μm.
Figure 3
Figure 3
GFP–RBD-3-R59A,N64D reports activation of endogenous Ras. (A) COS-7 cells transfected with GFP–RBD-3-R59A,N64D were deprived of serum and challenged with 50 ng/ml epidermal growth factor (EGF). Confocal pictures were taken at the indicated time points. GFP, green fluorescent protein; RBD, Ras-binding domain of the Ras effector c-Raf. (B) COS-7 cells stably expressing Myc–Ha-RasS17N under the control of an anhydrotetracycline (ATC)-responsive promoter were cultured in the presence or absence of ATC (Myc–Ha-RasS17N expression off or on, respectively), serum starved and challenged with 50 ng/ml EGF or 100 nM 12-O-tetradecanoylphorbol-13-acetate (TPA). Cells were lysed and processed in a Ras-GTP pull-down assay. A representative result of four experiments carried out on two different COS-7/Ha-RasS17N clones is shown. (C) COS-7 cells with inducible expression of Myc–Ha-RasS17N were cultured as in B. Cells were transfected with GFP–RBD-3-R59A,N64D, deprived of serum and stimulated with 50 ng/ml EGF or 100 nM TPA. Confocal images were captured after the indicated time periods. More than 80% of transfected cells showed the same response. Scale bars, 10 μm.
Figure 4
Figure 4
Ras activation in PC12 cells proceeds at the plasma membrane but not at the Golgi. (A) Serum-starved PC12 cells transfected with GFP–RBD-3 were stained with the Golgi marker BODIPY-TR-C5-ceramide, challenged with 50 ng/ml nerve growth factor (NGF) or epidermal growth factor (EGF) and imaged alive. White and green, GFP–RBD-3; red, BODIPY-TR-C5-ceramide. GFP, green fluorescent protein; RBD, Ras-binding domain of the Ras effector c-Raf. Scale bars, 10 μm. (B) Quantification of fluorescence associated with the plasma membrane (PM) and Golgi for the experiments shown in (A), plotted as the ratio of mean pixel fluorescence intensity at the PM or Golgi to cytosol versus time (mean±s.e.m.; NGF: n=6; EGF: n=9). The value for the unstimulated cell was set as 1. For a description of the quantification procedure, see supplementary Fig 8 online.
Figure 5
Figure 5
12-O-tetradecanoylphorbol-13-acetate/ionomycin activation of Ras in Jurkat cells does not occur at the Golgi. (A) Serum-starved Jurkat cells were challenged with 150 nM 12-O-tetradecanoylphorbol-13-acetate (TPA) plus 500 ng/ml ionomycin or anti-CD3 plus anti-CD28 (5 μg/ml each), to activate the T-cell receptor, lysed and processed in a Ras-GTP pull-down assay. (B) Serum-starved Jurkat cells expressing GFP–RBD-3-R59A were stained with BODIPY-TR-C5-ceramide, challenged with TPA/ionomycin and imaged alive. White and green, GFP–RBD-3-R59A; red, BODIPY-TR-C5-ceramide. GFP, green fluorescent protein; RBD, Ras-binding domain of the Ras effector c-Raf. (C) Quantification of fluorescence associated with the plasma membrane and Golgi for the experiment shown in (B) (n=8). Refer to legend to Fig 4B. (D) Serum-starved Jurkat cells were stimulated with TPA/ionomycin as before. At 3 min after stimulation, the cell suspension was made up to 5 μM bisindolylmaleimide I (BIM). After the indicated time points, samples were processed in a Ras-GTP pull-down assay. (E) Serum-starved Jurkat cells expressing GFP–RBD-3-R59A were challenged with TPA/ionomycin and imaged confocally. In the lower panel, the medium was made up to 5 μM BIM at the indicated time point. Scale bars, 10 μm.

References

    1. Bivona TG, Perez De Castro I, Ahearn IM, Grana TM, Chiu V, Lockyer PJ, Cullen PJ, Pellicer A, Cox AD, Philips MR (2003) Phospholipase Cγ activates Ras on the Golgi apparatus by means of RasGRP1. Nature 424: 694–698 - PubMed
    1. Bondeva T, Balla A, Varnai P, Balla T (2002) Structural determinants of Ras–Raf interaction analyzed in live cells. Mol Biol Cell 13: 2323–2333 - PMC - PubMed
    1. Caloca MJ, Zugaza JL, Bustelo XR (2003) Exchange factors of the RasGRP family mediate Ras activation in the Golgi. J Biol Chem 278: 33465–33473 - PubMed
    1. Carrasco S, Merida I (2004) Diacylglycerol-dependent binding recruits PKCθ and RasGRP1 C1 domains to specific subcellular localizations in living T lymphocytes. Mol Biol Cell 15: 2932–2942 - PMC - PubMed
    1. Chiu VK, Bivona T, Hach A, Sajous JB, Silletti J, Wiener H, Johnson RL II, Cox AD, Philips MR (2002) Ras signalling on the endoplasmic reticulum and the Golgi. Nat Cell Biol 4: 343–350 - PubMed

Publication types