. 2005 Dec;17(12):3337-49.
doi: 10.1105/tpc.105.036814. Epub 2005 Nov 11.

The Arabidopsis thaliana SOMATIC EMBRYOGENESIS RECEPTOR-LIKE KINASES1 and 2 control male sporogenesis

Affiliations
Free PMC article

The Arabidopsis thaliana SOMATIC EMBRYOGENESIS RECEPTOR-LIKE KINASES1 and 2 control male sporogenesis

Catherine Albrecht et al. Plant Cell. 2005 Dec.
Free PMC article

Abstract

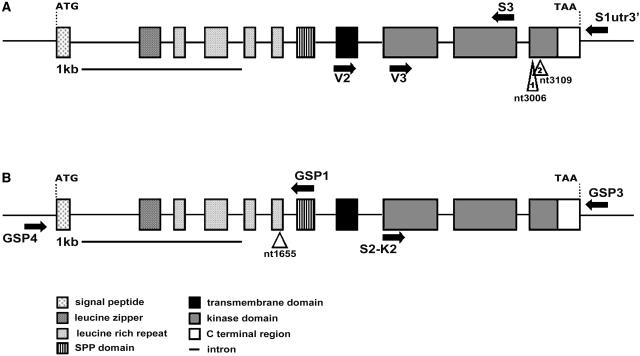
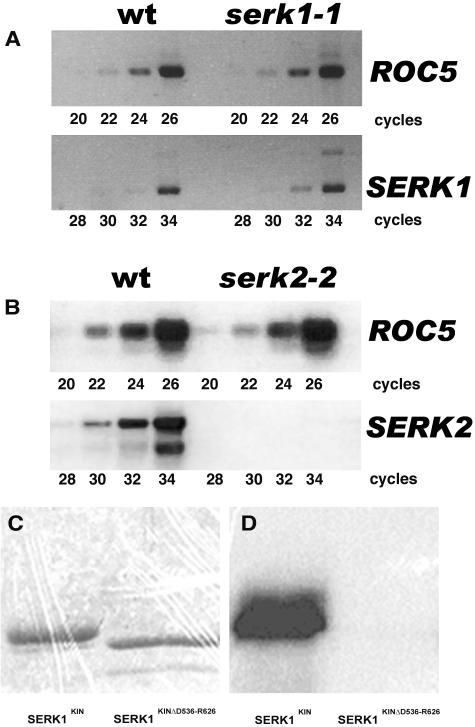
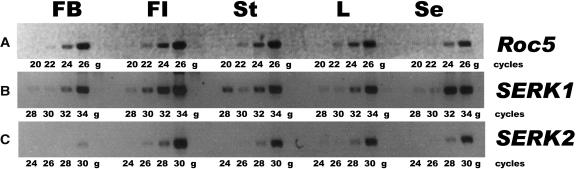
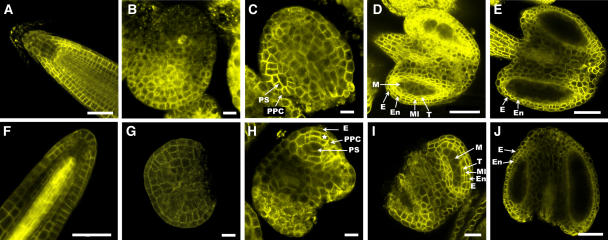
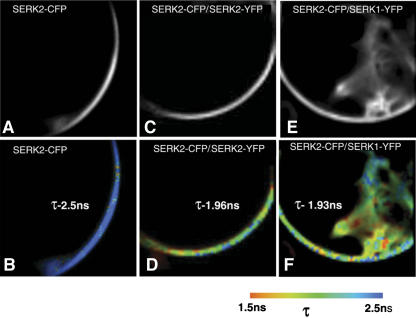
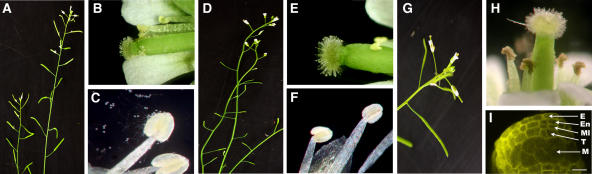
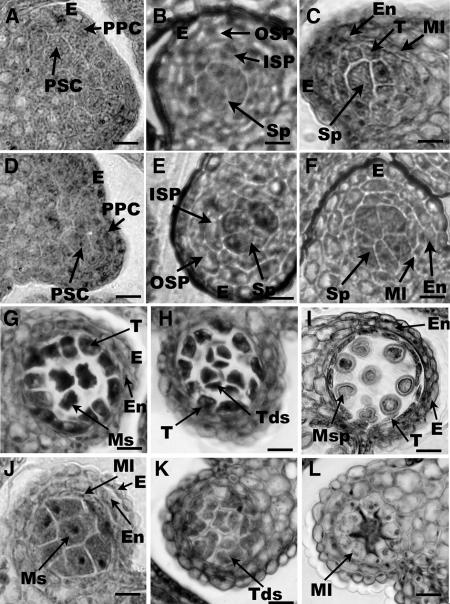
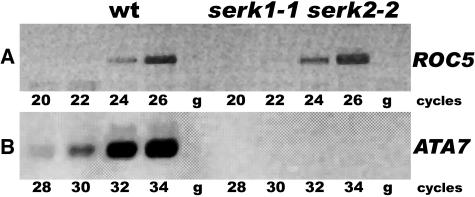
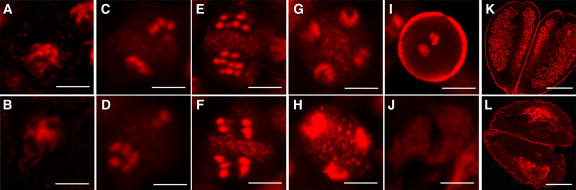
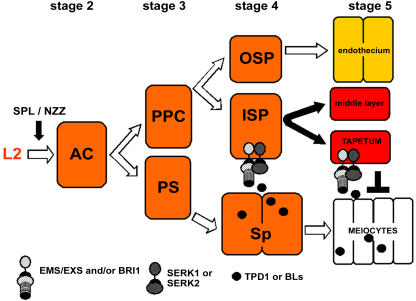
The Arabidopsis thaliana SOMATIC EMBRYOGENESIS RECEPTOR-LIKE KINASE (SERK) family of plasma membrane receptors consists of five closely related members. The SERK1 and SERK2 genes show a complex expression pattern throughout development. Both are expressed in anther primordia up to the second parietal division. After this point, expression ceases in the sporocytes and is continued in the tapetum and middle layer precursors. Single knockout mutants of SERK1 and SERK2 show no obvious phenotypes. Double mutants of SERK1 and SERK2 are completely male sterile due to a failure in tapetum specification. Fertility can be restored by a single copy of either gene. The SERK1 and SERK2 proteins can form homodimers or heterodimers in vivo, suggesting they are interchangeable in the SERK1/SERK2 signaling complex.


Figures

Figure 1.
Figure 1.
Characterization of SERK1 and SERK2 Loci. (A) Characterization of the SERK1 locus. Arrowheads 1 and 2 indicate the positions of the T-DNA insertions in serk1-1 and serk1-2 mutant alleles, respectively. The position of the primers used for RT-PCR and genotyping analysis is indicated. Bar = 1 kb. (B) Characterization of the SERK2 locus. The arrowhead indicates the position of the T-DNA insertion in the serk2-2 mutant allele. The position of the primers used for RT-PCR and genotyping analysis is indicated. Bar = 1 kb.
Figure 2.
Figure 2.
Molecular Analysis of serk1-1 and serk2-2 Mutant Alleles. (A) Semiquantitative RT-PCR analysis of SERK1 transcripts in the wild type and the serk1-1 mutant. (B) Semiquantitative RT-PCR analysis of SERK2 transcripts in the wild type and the serk2-2 mutant. The ROC5 gene was amplified simultaneously as a control in both experiments. (C) Bacterially produced SERK1kin and SERK1kinΔD536-R626 proteins were affinity purified and incubated with [γ-32P]ATP. After separation on 10% SDS-PAGE, the resulting gels were stained with Coomassie blue. (D) Same gels after autoradiography using a PhosphorImager.
Figure 3.
Figure 3.
SERK1 and SERK2 Expression during Plant Development Determined by Semiquantitative RT-PCR. (A) ROC5 expression pattern. (B) SERK1 expression pattern. (C) SERK2 expression pattern. “g” is the control for genomic contamination and is performed on non-reverse-transcribed total RNA at 34 cycles for SERK1, 30 cycles for SERK2, and 26 cycles for ROC5. FB, flower buds; FI, opened flowers containing embryos from stage 0 through 7; St, stem; L, leaves; Se, seedlings 7 d after germination.
Figure 4.
Figure 4.
SERK1 and SERK2 Localization. (A) SERK1 expression in root tip. (B) SERK1 expression in anther primordial at stage 1. (C) SERK1 expression in anther at stage 3. (D) SERK1 expression in anther at stage 5. (E) SERK1 expression in mature anther. (F) SERK2 expression in root tip. (G) SERK2 expression in anther primordial at stage 1. (H) SERK2 expression in anther at stage 3. (I) SERK1 expression in anther at stage 5. (J) SERK2 expression in mature anther. The star indicates cells of the preparietal cell layer that have divided to give rise to the outer and inner secondary parietal layers. PPC, preparietal cell layer; PS, primary sporogenous cell layer; E, epidermis; En, endothecium; Ml, middle layer; M, meiocytes; T, tapetum. Bars = 50 μM for (A), (D), (F), (J), and (E), 20 μM for (I), and 10 μM for (B), (C), (G), and (H).
Figure 5.
Figure 5.
FRET between SERK1 and SERK2 Imaged by FLIM. FLIM on cowpea protoplast transiently expressing SERK2-CFP ([A] and [B]) SERK2-CFP/SERK2-YFP ([C] and [D]), and SERK2-CFP/SERK1-YFP ([E] and [F]) for 16 h. Intensity images representing a steady state of the donor SERK2-CFP fluorescence are presented in (A), (C), and (E). The mean fluorescence lifetime values (τ) and the lifetime distribution for the images in (A), (C), and (E) are presented as pseudocolor images in (B), (D), and (F). Note the color bar where dark blue color is used to display τ = 2.5 ns (no interaction) and the red to dark orange color to display τ = 1.5 ns (interaction).
Figure 6.
Figure 6.
Phenotype of the serk1-1 serk2-2 Double Mutant and the Complemented Mutant by the SERK1 cDNA-YFP Fusion Driven by the SERK1 Promoter (PSERK1:SERK1-YFP). (A) Inflorescence of a wild-type plant showing normal seed pods. (B) A wild-type flower showing pollen grains. (C) A wild-type anther showing germinating pollen grain. (D) Inflorescence of the serk1-1 serk2-2 double mutant with small seedpods and no developing seeds. (E) A double serk1-1 serk2-2 mutant flower with shortened anther filament and no pollen grain. (F) A close-up of the double serk1-1 serk2-2 mutant anther with no pollen grain. (G) Plant from a complemented transgenic double serk1-1 serk2-2 mutant showing normal seed pot. (H) PSERK1:SERK1-YFP complemented double mutant flower showing pollen grain. (I) Anther of a PSERK1:SERK1-YFP complemented double mutant visualized by confocal microscopy showing the five characteristic layers of an anther at stage 5. M, meiocytes; T, tapetum; Ml, middle layer; En, endocethium; E, epidermis. Bar = 10 μm.
Figure 7.
Figure 7.
Anther Development in the Double serk1-1 serk2-2 Mutant. Micrographs of one of the four lobes of the wild type and double mutant stained with Toluidine blue. PPC, primary parietal cells; PSC, primary sporogenous cells; ISP, inner secondary parietal layer; OSP, outer secondary parietal layer; Sp, sporocytes; E, epidermis; En, endothecium; Ml, middle layer; Ms, microsporocytes; Msp, microspores; T, tapetal layer; Tds, tetrads. Bars = 10 μm. (A) Wild-type anther at stage 3 showing the inner primary sporogenous layer and the outer primary parietal layer. (B) Wild-type anther at early stage 4 showing the inner and outer secondary parietal cell layer. (C) Wild-type anther at late stage 5 showing the well organized four anther layers, the epidermis, the endothecium, the middle layer, and the tapetum and the sporocytes developing in the middle of the locule. (D) serk1-1 serk2-2 double mutant at stage 3 showing the inner primary sporogenous layer and the outer primary parietal layer. (E) serk1-1 serk2-2 double mutant anther at late stage 4 showing the two characteristic inner and outer secondary parietal cell layers. (F) serk1-1 serk2-2 double mutant anther at late stage 5 showing the absence of the tapetal layer and an aberrant number of microsporocytes. (G) Wild-type anther at stage 6 showing isolated microsporocytes, highly vacuolated tapetum cells, a collapsing middle layer, the endocethium, and the epidermis. (H) Wild-type anther at stage 7 with tetrads. (I) Wild-type anther at stage 11 with pollen grains and degenerating tapetum. (J) serk1-1 serk2-2 double mutant anther at stage 6 showing enlarged and undetached microspores. The middle layer has not degenerated. (K) serk1-1 serk2-2 double mutant anther at stage 7 with degenerating tetrads. (L) serk1-1 serk2-2 double mutant anther at stage 11 showing the cell debris of the collapsed meiocytes and a persistent and highly vacuolated middle layer.
Figure 8.
Figure 8.
Expression of ATA7 in the serk1-1 serk2-2 Double Mutant. ATA7, a tapetum-specific marker, is not expressed in the serk1-1 serk2-2 double mutant. PCR products were collected after 28, 30, 32, and 34 cycles for ATA7 and after 20, 22, 24, and 26 cycles for ROC5. “g” stands for the control on genomic contamination and is performed on non-reverse-transcribed total RNA at 34 cycles for ATA7 and 26 cycles for ROC5. (A) ROC5 expression pattern. (B) ATA7 expression pattern.
Figure 9.
Figure 9.
Male Meiosis in the serk1-1 serk2-2 Double Mutant. Micrographs of wild-type and serk1-1 serk2-2 double mutant anthers stained with propidium iodide and viewed by confocal microscopy. Bars = 10 μm for (A) to (J) and 20 μm for (K) and (L). (A) Wild type pachytene chromosomes. (B) serk1-1 serk2-2 pachytene chromosomes. (C) Wild-type anaphase I. (D) serk1-1 serk2-2 anaphase I. (E) Wild-type anaphase II. (F) serk1-1 serk2-2 anaphase II. (G) Wild-type telophase II. (H) serk1-1 serk2-2 telophase II. (I) Wild-type pollen grain after mitosis I. (J) serk1-1 serk2-2 degenerated tetrads. (K) Wild-type mature anther showing pollen grain. (L) serk1-1 serk2-2 collapsed anther.
Figure 10.
Figure 10.
A Model for the SERK1-SERK2 Signaling Pathway in the Anther. TDP1 and/or brassinosteroids produced in the developing meiocytes (Sp) signal the surrounding immature tapetal cells (ISP) through SERK1-SERK2/EMS-EXS or SERK1-SERK2/BRI1, respectively. Perception of the TPD1 and/or brassinosteroid signals ensures specification and maintenance of the tapetal and middle cell fate. One proposed function of the tapetum is to inhibit further proliferation of the meiocytes. In the serk1-1 serk2-2 double mutant, specification of the tapetal cells does not occur. As a result, tapetal cells either adopt a meiocyte fate or the inner secondary parietal layer cells only form the middle layer. In both situations, formation of extra meiocytes occurs. Red-colored cells are expressing the SERK1 and SERK2 genes moderately (light red) or highly (dark red). Only anther stages 2 to 5 are represented. AC, archesporial cell; PPC, preparietal cell; PS, primary sporogenous cell layer; ISP, inner secondary parietal layer; OSP, outer secondary parietal layer; Sp, sporocyte; BLs, brassinosteroids.

Similar articles

Cited by

References

    1. Alonso, J.M., et al. (2003). Genome-wide insertional mutagenesis of Arabidopsis thaliana. Science 301, 653–657. - PubMed
    1. Becker, W., Bergmann, A., Hink, M.A., Konig, K., Benndorf, K., and Biscup, C. (2004). Fluorescence lifetime imaging by time-correlated single-photon counting. Microsc. Res. Tech. 63, 58–66. - PubMed
    1. Bicknell, R.A., and Koltunow, A.M. (2004). Understanding apomixis: Recent advances and remaining conundrums. Plant Cell 16 (suppl.), S228–S245. - PMC - PubMed
    1. Borst, J.W., Hink, M., van Hoek, A., and Visser, A.J.W.G. (2003). Multiphoton microspectroscopy in living plant cells. In Multiphoton Microscopy in the Biomedical Sciences III, A. Periasamy and P.T. So, eds (Bellingham, WA: SPIE), pp. 231–238.
    1. Canales, C., Bhatt, A.M., Scott, R., and Dickinson, H. (2002). EXS, a putative LRR receptor kinase, regulates male germline cell number and tapetal identity and promotes seed development in Arabidopsis. Curr. Biol. 12, 1718–1727. - PubMed

Publication types

Substances

Associated data