. 2005 Dec;17(12):3239-56.
doi: 10.1105/tpc.105.035840. Epub 2005 Nov 11.

Conservation and divergence of light-regulated genome expression patterns during seedling development in rice and Arabidopsis

Affiliations
Free PMC article

Conservation and divergence of light-regulated genome expression patterns during seedling development in rice and Arabidopsis

Yuling Jiao et al. Plant Cell. 2005 Dec.
Free PMC article

Abstract

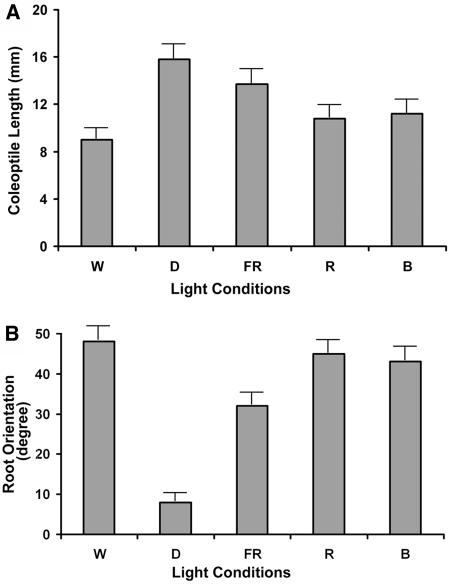
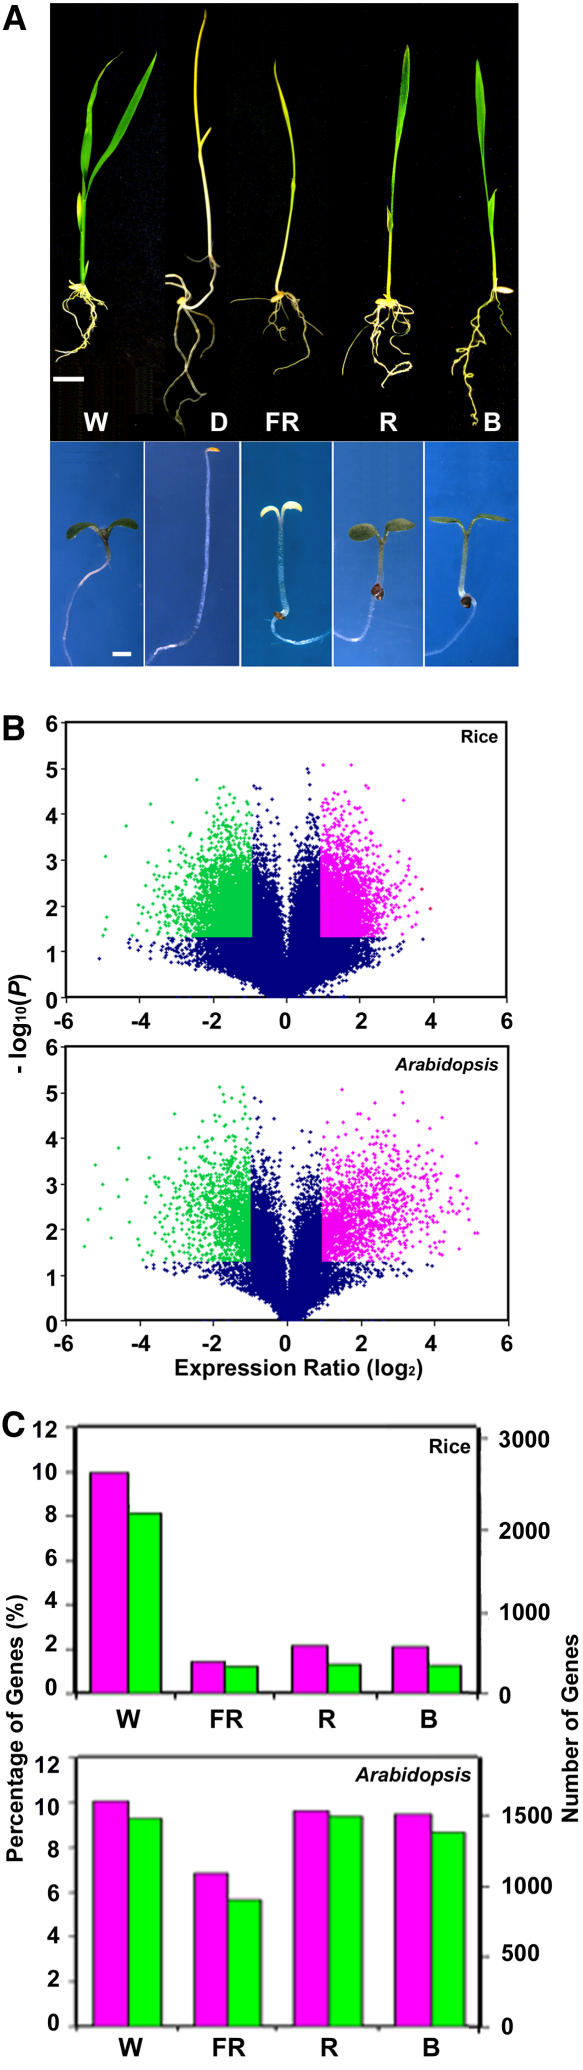
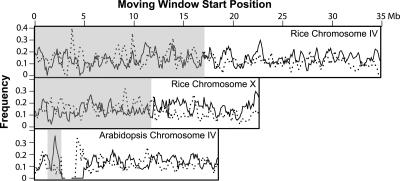
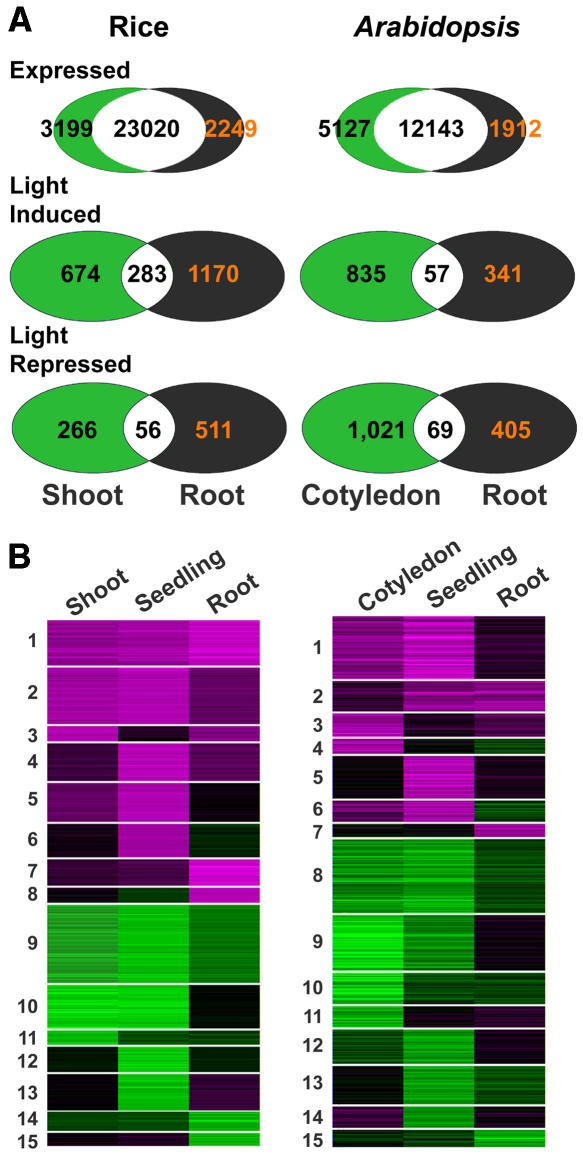
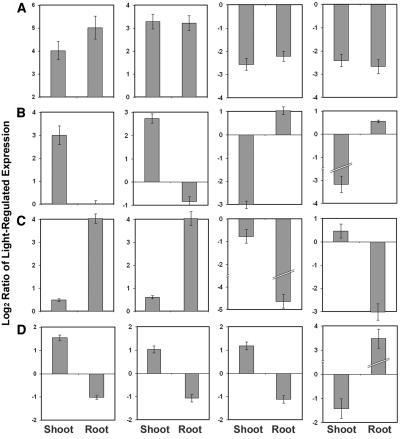
Genome-wide 70-mer oligonucleotide microarrays of rice (Oryza sativa) and Arabidopsis thaliana were used to profile genome expression changes during light-regulated seedling development. We estimate that the expression of approximately 20% of the genome in both rice and Arabidopsis seedlings is regulated by white light. Qualitatively similar expression profiles from seedlings grown under different light qualities were observed in both species; however, a quantitatively weaker effect on genome expression was observed in rice. Most metabolic pathways exhibited qualitatively similar light regulation in both species with a few species-specific differences. Global comparison of expression profiles between rice and Arabidopsis reciprocal best-matched gene pairs revealed a higher correlation of genome expression patterns in constant light than in darkness, suggesting that the genome expression profile of photomorphogenesis is more conserved. Transcription factor gene expression under constant light exposure was poorly conserved between the two species, implying a faster-evolving rate of transcription factor gene expression in light-grown plants. Organ-specific expression profiles during seedling photomorphogenesis provide genome-level evidence for divergent light effects in different higher plant organs. Finally, overrepresentation of specific promoter motifs in root- and leaf-specific light-regulated genes in both species suggests that these cis-elements are important for gene expression responses to light.


Figures

Figure 1.
Figure 1.
Relationship between White Light Irradiation Intensities and the Growth Responses of Rice Seedlings. (A) Effect of light intensities on coleoptile inhibition. (B) Effect of light intensities on crown root gravitropic growth. Each point represents the mean of 20 measurements.
Figure 2.
Figure 2.
Morphological Phenotype Comparison of Rice Seedlings under Different Light Qualities and in Darkness. Ten-day-old rice seedlings were grown under continuous W, FR, R, and B light and in darkness. Effect of distinct light qualities on coleoptile inhibition (A) and crown root gravitropic growth (B) were measured based on 15 seedlings or more. Error bars represent se.
Figure 3.
Figure 3.
Light-Regulated Morphological and Genome Expression Changes between Rice and Arabidopsis. (A) Top: 10-d-old rice seedlings grown under continuous W, FR, R, and B light and in darkness. Bar = 10 mm. Bottom: 6-d-old Arabidopsis seedlings. Bar = 1 mm. (B) Volcano plot where log2-transformed gene expression intensity ratios are plotted against the negative log10-transformed P value from a Student's t test. Genes with statistically different expression (P value < 0.05) and fold changes above 2 are considered to be induced genes and are shown in red. Genes with statistically different expression and fold changes below −2 are considered to be repressed genes and are shown in green. (C) Summary of expressed genes induced (red) and repressed (blue) beyond twofold by light in each light quality. Both percentages and numbers of genes are shown.
Figure 4.
Figure 4.
Light Regulation of Genome Expression. (A) Overview of light-regulated genome expression by cluster display. W, continuous W light versus dark; FR, continuous far red light versus dark; R, continuous red light versus dark; B, continuous blue light versus dark. The color scale is shown at the bottom. Positive numbers represent fold of induction, and negative numbers represent fold of repression. All rice seedlings were grown at 28°C for 10 d, while Arabidopsis seedlings were grown at 20°C for 6 d. All of those genes that exhibited a twofold or higher differential expression in at least one time point were included. (B) to (I) Expression profiles of eight representative genes with reciprocal best-matched genes from rice and Arabidopsis, respectively. Biosynthesis pathways ([B] and [C]), utilization/assimilation/degradation pathways ([D], [E], [H], and [I]), and pathways that generate precursor metabolites and energy ([F] and [G]) were represented. (B) O-acetylserine thiollyase (At3g03630 and OsJRFA065652); (C) chlorophyll synthetase (At3g51820 and OsJRFA068855); (D) glyceraldehyde-3-phosphate dehydrogenase (At1g42970 and OsIFCC017765); (E) galactose (galactoside/glucose catabolism) (At5g51820 and OsJRFA068502); (F) ribose 5-phosphate isomerase (At5g44520 and OsJRFA060861); (G) light-harvesting chlorophyll a/b binding protein (At3g54890 and OsIFCC010436); (H) Phe ammonia-lyase (At3g10340 and OsIFCC040013); (I) CTP oxidase (pyrimidine ribonucleotide metabolism) (At4g20320 and OsJRFA070411). Bars in each graph of (B) to (I) correspond to the log2-transformed expression ratios of W, FR, R, and B light compared with dark. Arabidopsis data are shown in patterned bars and rice in filled bars.
Figure 5.
Figure 5.
Diagram of Representative Biosynthesis Pathways for Rice (Left) and Arabidopsis (Right). Each pathway is shown as glyphs consisting of nodes, which represent the metabolites, and lines, which represent the reactions. Expression-level change of each reaction is shown in a color relative to the expression level. Missing gene expression data, which may come from lack of annotated enzyme, lack of microarray probe, or lack of expression, are represented by gray lines.
Figure 6.
Figure 6.
Shared Transcriptional Signature of Light Regulation in Major Metabolic Pathways. (A) Five representative biosynthesis pathways. (B) Six representative utilization/assimilation/degradation pathways. (C) Three representative precursor metabolites and energy pathways. Conserved patterns in the gene expression data sets from rice and Arabidopsis that corresponded to five biosynthesis (A), six utilization/assimilation/degradation (B), and three precursor metabolites and energy pathways (C) (http://www.arabidopsis.org/tools/aracyc/) were identified. For each pathway, rectangular blocks represented the measured changes in expression of each gene. All homolog pairs in each pathway are shown. In each pathway block, rice genes are in the top row, while Arabidopsis is in the bottom row.
Figure 7.
Figure 7.
Distribution of Light-Regulated Genes along Representative Chromosomes. For each chromosome, the frequency (percentage) of light-induced genes (solid line) or light-repressed genes (dotted line) is shown in a series of 100-kb windows with moving steps of 50 kb. The position of the window start point along the chromosome is given at the top. Cytologically defined heterochromatic regions are highlighted with a gray background.
Figure 8.
Figure 8.
Proportion of Light-Regulated Genes in the Entire Genome and among the Rice–Arabidopsis Reciprocal Best-Matched Genes. Numbers in each bar are percentages of light-induced and light-repressed genes in all expressed genes or in all expressed best-matched genes.
Figure 9.
Figure 9.
Correlated Regulation of Reciprocal Best-Matched Gene Expression during Photomorphogenesis in Rice and Arabidopsis. Microarray measurements of gene expression at each light condition were paired for 7196 best-matched genes from rice and Arabidopsis. Pearson correlations (r) with their significance (P values) for best-matched gene pairs at different light conditions are shown by arrows on the right. A distribution of Pearson correlations of 100,000 random pairings of rice and Arabidopsis gene expression data is shown on the left.
Figure 10.
Figure 10.
Light-Regulated Genome Expression in Separate Organs. (A) Venn diagrams of expressed genes, light-induced genes, and light-repressed genes in each organ. (B) All genes with differential expression in shoots, roots, or whole seedlings were divided into 15 clusters using K-means algorithm. The color scale is the same as in Figure 4A.
Figure 11.
Figure 11.
Organ-Specific Light-Regulated Gene Expression. (A) Expression profiles of four rice genes with similar light regulation in shoots and in roots. From left to right: OsIFCC043471, putative photosystem I reaction center subunit II precursor; OsIFCC036192, AP2 domain transcription factor; OsIFCC002877, ketol-acid reductoisomerase; OsIFCC042813, unknown function protein. (B) Expression profiles of four rice genes with light regulation only in shoots. From left to right: OsIFCC011070, Leu-rich repeat transmembrane protein kinase; OsJRFA103597, aldehyde oxidase; OsIFSC048192, extensin; OsIFCC028968, 1-aminocyclopropane-1-carboxylate oxidase (ethylene biosynthesis). (C) Expression profiles of four rice genes with light regulation only in roots. From left to right: OsIFCC004995, ribosomal protein L11; OsIFCC019376, actin binding protein; OsIFCC032722, sugar porter; OsIFSC045999, G-protein coupled receptor. (D) Expression profiles of four rice genes with opposite light regulation in shoots and roots. From left to right: OsIFCC004650, putative glutathione transferase; OsIFCC002739, putative cytochrome P450; OsIFCC033515, putative SCARECROW-like transcription factor; OsIFCC010934, putative thionin. Bars in each graph of (A) to (D) correspond to the log2-transformed expression ratios of W light compared with dark.
Figure 12.
Figure 12.
Motifs Discovered from Light-Regulated Arabidopsis Gene Promoters. Sequence logo, which represents a motif matrix, a common name, if known, the significance from Sift, and the enrichment in rice and Arabidopsis are provided. Enrichment was acquired by subtracting the presence of a motif in all gene promoters from the presence in target gene promoters. (A) Motifs were overrepresented in light-induced genes in common between cotyledons and root. (B) Motifs were overrepresented in light-induced genes specific for cotyledons. (C) Motifs were overrepresented in light-induced genes specific for root. (D) Motifs were overrepresented in light-repressed genes common between cotyledons and root. (E) Motifs were overrepresented in light-repressed genes specific for cotyledons.

Similar articles

Cited by

References

    1. Basu, D., Dehesh, K., Schneider-Poetsch, H.J., Harrington, S.E., McCouch, S.R., and Quail, P.H. (2000). Rice PHYC gene: Structure, expression, map position and evolution. Plant Mol. Biol. 44, 27–42. - PubMed
    1. Berardini, T.Z., et al. (2004). Functional annotation of the Arabidopsis genome using controlled vocabularies. Plant Physiol. 135, 745–755. - PMC - PubMed
    1. Blanc, G., and Wolfe, K.H. (2004). Widespread paleopolyploidy in model plant species inferred from age distributions of duplicate genes. Plant Cell 16, 1667–1678. - PMC - PubMed
    1. Blancaflor, E.B., and Masson, P.H. (2003). Plant gravitropism. Unraveling the ups and downs of a complex process. Plant Physiol. 133, 1677–1690. - PMC - PubMed
    1. Blecken, J., Weisshaar, B., and Herzfeld, F. (1994). Two distinct cis-acting elements are involved in light-dependent activation of the pea elip promoter. Mol. Gen. Genet. 245, 371–379. - PubMed

Publication types

MeSH terms

Associated data