. 2005 Dec;115(12):3484-93.
doi: 10.1172/JCI24059. Epub 2005 Nov 10.

Complete rescue of obesity, diabetes, and infertility in db/db mice by neuron-specific LEPR-B transgenes

Affiliations

Complete rescue of obesity, diabetes, and infertility in db/db mice by neuron-specific LEPR-B transgenes

Carl de Luca et al. J Clin Invest. 2005 Dec.

Abstract

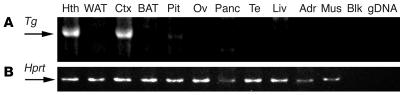
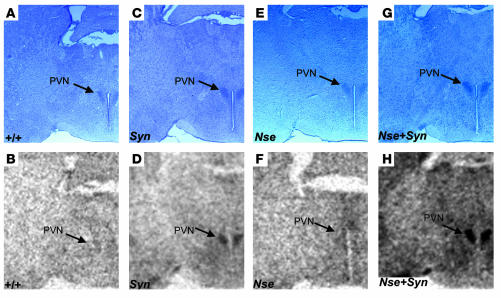
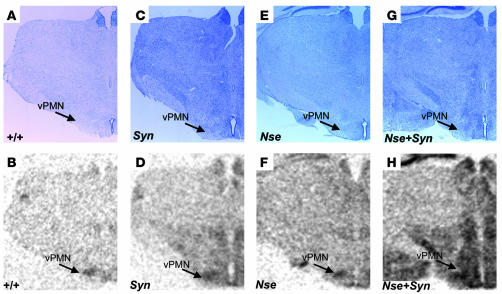
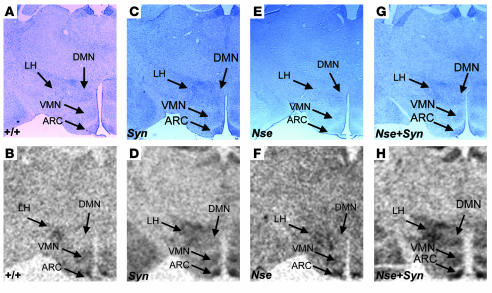
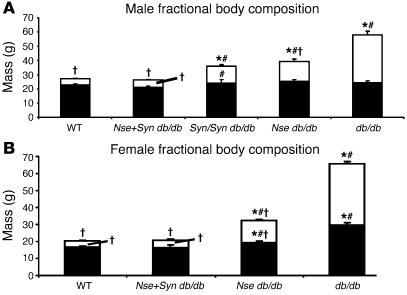
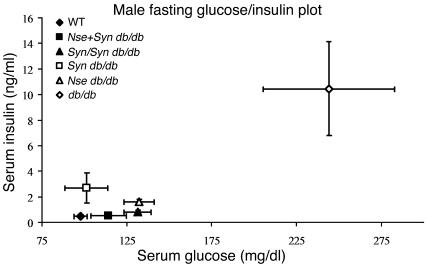
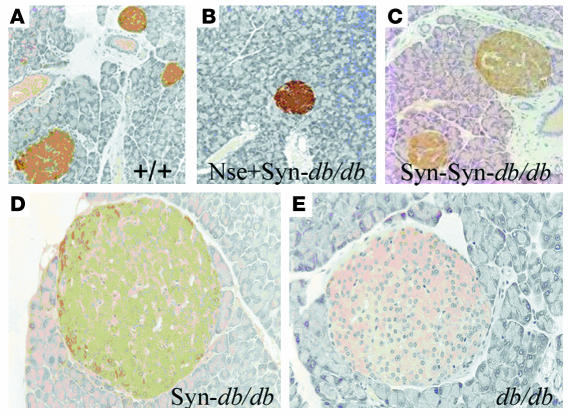
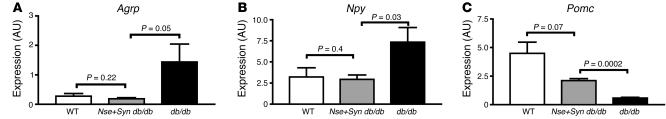
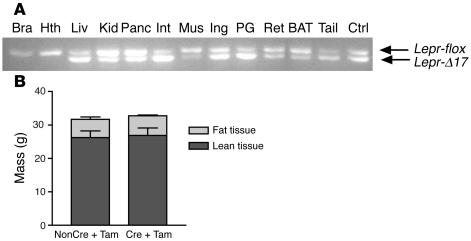
We have generated mice that carry a neuron-specific leptin receptor (LEPR) transgene whose expression is driven by the rat synapsin I promoter synapsin-LEPR B (SYN-LEPR-B). We have also generated mice that are compound hemizygotes for the transgenes SYN-LEPR-B and neuron-specific enolase-LEPR B (NSE-LEPR-B). We observed a degree of correction in db/db mice that are hemizygous (Syn db/db) and homozygous (Syn/Syn db/db) for the SYN-LEPR-B transgene similar to that previously reported for the NSE-LEPR-B transgene. We also show complete correction of the obesity and related phenotypes of db/db mice that are hemizygous for both NSE-LEPR-B and SYN-LEPR-B transgenes (Nse+Syn db/db). Body composition, insulin sensitivity, and cold tolerance were completely normalized in Nse+Syn db/db mice at 12 weeks of age compared with lean controls. In situ hybridization for LEPR B isoform expression in Nse+Syn db/db mice showed robust expression in the energy homeostasis-relevant regions of the hypothalamus. Expression of 3 neuropeptide genes, agouti-related peptide (Agrp), neuropeptide Y (Npy), and proopiomelanocortin (Pomc), was fully normalized in dual transgenic db/db mice. The 2 transgenes in concert conferred normal fertility to male and female db/db mice. Male mice with partial peripheral deletion of Lepr, induced in the periweaning phase, did not show alterations in body composition or mass. In summary, we show that brain-specific leptin signaling is sufficient to reverse the obesity, diabetes, and infertility of db/db mice.


Figures

Figure 1
Figure 1
Transgene tissue expression. (A) SYN-LEPR-B transgene expression analysis in several tissues of Syn-db3J/db3J mice. A bp fragment of approximately 1100 is generated from tissue cDNA when the SYN-LEPR-B transgene is expressed. (B) Expression of Hprt is used as a loading control. Fragments from Hprt generate a 195-bp fragment. Lanes correspond to tissues in A and B. Hth, hypothalamus; WAT, white adipose tissue; Ctx, cerebral cortex; BAT, brown adipose tissue; Pit, pituitary gland; Ov, ovary; Panc, pancreas; Te, testes; Liv, liver; Adr, adrenal gland; Mus, skeletal muscle; Blk, blank. gDNA is used as a control for genomic DNA contamination.
Figure 2
Figure 2
Transgene expression in the PVN. In situ hybridization of LEPR-B mRNA in hypothalamic brain sections, including the PVN. Counterstained sections are represented in A, C, E, and G, and in situ hybridization autoradiographic images are represented in B, D, F, and H. Genotypes are indicated. A and B represent +/+ mice, C and D represent Syn db/db mice, E and F represent Nse db/db mice, and G and H represent Nse+Syn db/db mice. The NSE-LEPR-B transgene (F) and wild-type LEPR-B (B) are weakly expressed in the PVN when compared with the SYN-LEPR-B transgene (D). The complementation of expression pattern is evident in (H), where both transgenes are coexpressed in Nse+Syn db/db mice. Magnification, ×20.
Figure 3
Figure 3
Transgene expression in ventral PMN (vPMN). In situ hybridization of LEPR-B mRNA in 25-μM hypothalamic brain sections including vPMN. Two counterstained sections are represented in A, C, E, and G, and in situ hybridization autoradiographic images are represented in B, D, F, and H. Genotypes are indicated. A and B represent +/+ mice, C and D represent Syn db/db mice, E and F represent Nse db/db mice, and G and H represent Nse+Syn db/db mice. In the vPMN, there is weaker and more diffuse signal intensity from the SYN-LEPR-B transgene (D) in contrast to a more restricted and higher relative intensity signal from the NSE-LEPR-B transgene (F). In C, both transgenes combined increase signal intensity in the Nse+Syn db/db mice. Magnification, ×20.
Figure 4
Figure 4
Transgene expression in the ARC, VMN, DMN, and LH. In situ hybridization of LEPR-B mRNA in hypothalamic brain sections, including ARC, VMH, DMH, and LH. Counterstained sections are represented in A, C, E, and G, and in situ hybridization autoradiographic images are represented in B, D, F, and H. Genotypes are indicated. A and B represent +/+ mice, C and D represent Syn db/db mice, E and F represent Nse db/db mice, and G and H represent Nse+Syn db/db mice. In the ARC, the SYN-LEPR-B and NSE-LEPR-B transgenes and wild-type LEPR-B are all expressed in the ARC. H shows a stronger signal, probably from the additive effect of the coexpression in both transgenes within the ARC. In the DMN, VMN, and LH, there is a relatively stronger expression signal from the SYN-LEPR-B transgene (D) when compared with the NSE-LEPR-B transgene (F). The additive and complementary effect of coexpression is observed in the VMN, DMN, and LH in this brain section from Nse+Syn db/db mice (H). Magnification, ×20.
Figure 5
Figure 5
Body composition analysis. (A) Fat mass and lean mass are normalized in male Nse+Syn db/db mice, but also note the partial decrease in fat mass in both Nse db/db and Syn/Syn db/db males. (B) Fat mass and lean mass are normalized in female Nse+Syn db/db mice. There is a partial correction of both lean and fat mass in Nse db/db female mice. *P < 0.05 vs. +/+, db/+; #P < 0.05 vs. Nse+Syn db/db; P < 0.05 vs. db/db. Fat mass is indicated by white component of column. Lean mass is indicated by black component of column. Values are mean ± SEM.
Figure 6
Figure 6
Glucose-insulin plots in fasting male mice. See plot for genotype and plot point assignment. This graphical representation of glucose metabolism in fasted male mice shows the ability of the SYN-LEPR-B and NSE-LEPR-B transgenes to ameliorate the diabetes phenotype in Nse db/db, Syn db/db, and Syn/Syn db/db mice and to completely correct it in Nse+Syn db/db mice. Values are mean ± SEM.
Figure 7
Figure 7
Normalization of pancreatic islet morphology in males. (A and B) Nse+Syn db/db and +/+ mice have comparable islet morphology. (C and D) The SYN-LEPR-B transgene shows a dosage-dependent rescue of islet morphology. (E) Obese control demonstrating enlarged pancreatic islet. Genotypes are indicated. Magnification, ×20.
Figure 8
Figure 8
Trangene effect on hypothalamic neuropeptide gene expression. (A) Agrp expression is normalized in Nse+Syn db/db mice compared with +/+. (B) Npy expression is normalized in Nse+Syn db/db mice compared with +/+. (C) Pomc expression is normalized in Nse+Syn db/db mice compared with +/+. P values are indicated. Values are mean ± SEM.
Figure 9
Figure 9
Deletion of peripheral signaling LEPR has no effect on adiposity. (A) Representative results of PCR-based genotyping of the Lepr locus in the tissues of male Cre+Tam mice. Four-month-old male Cre+Tam mice and nonCre+Tam controls were sacrificed 3 months after Tam treatment. PCR-based DNA analysis was used to determine the extent of the deletion of exon 17 (Lepr-δ17) in the brain (Bra), hypothalamus, liver, kidney (Kid), pancreas, small intestine (Int), skeletal muscle, inguinal fat (Ing), perigonadal fat (PG), retroperitoneal fat (Ret), brown adipose tissue, and tail. Tail DNA of a Leprflox/δ17 mouse was used as a control (Ctrl). (B) Body compositions of 4-month-old male Cre+Tam mice (n = 7) and their nonCre+Tam controls (n = 5) were determined using DEXA 3 months after Tam treatment.

References

    1. Zhang Y, et al. Positional cloning of the mouse obese gene and its human homologue. Nature. 1994;372:425–432. - PubMed
    1. Frederich RC, et al. Leptin levels reflect body lipid content in mice: evidence for diet-induced resistance to leptin action. Nat. Med. 1995;1:1311–1314. - PubMed
    1. Tartaglia LA. The leptin receptor. J. Biol. Chem. 1997;272:6093–6096. - PubMed
    1. Chua SC, Jr, et al. Phenotypes of mouse diabetes and rat fatty due to mutations in the OB (leptin) receptor. Science. 1996;271:994–996. - PubMed
    1. Chua SC., Jr Monogenic models of obesity. Behav. Genet. 1997;27:277–284. - PubMed

Publication types

MeSH terms