Comparative Study
. 2006 Feb;169(1):69-84.
doi: 10.1007/s00221-005-0130-y. Epub 2005 Nov 12.

Comparison of population activity in the dorsal premotor cortex and putamen during the learning of arbitrary visuomotor mappings

Affiliations
Comparative Study

Comparison of population activity in the dorsal premotor cortex and putamen during the learning of arbitrary visuomotor mappings

Ethan R Buch et al. Exp Brain Res. 2006 Feb.

Abstract

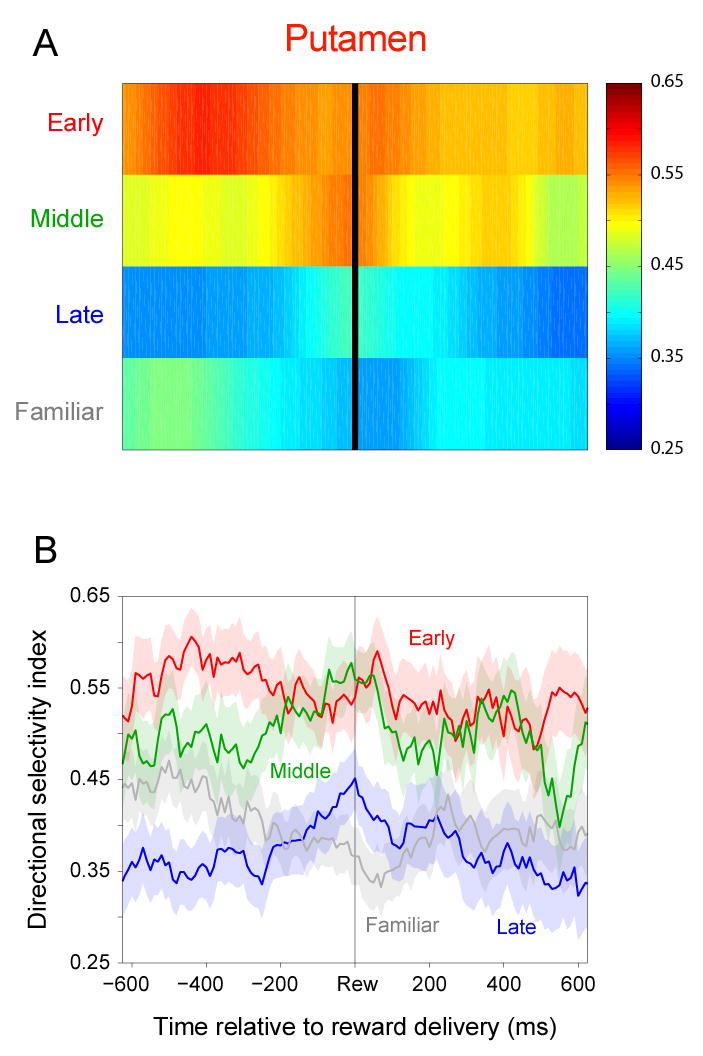
A previous study found that as monkeys learned novel mappings between visual cues and responses, neuronal activity patterns evolved at approximately the same time in both the dorsal premotor cortex (PMd) and the putamen. Here we report that, in both regions, the population activity for novel mappings came to resemble that for familiar ones as learning progressed. Both regions showed activity differences on trials with correct responses versus those with incorrect ones. In addition to these common features, we observed two noteworthy differences between PMd and putamen activity during learning. After a response choice had been made, but prior to feedback about the correctness of that choice (reward or nonreward), the putamen showed a sustained activity increase in activity, whereas PMd did not. Also in the putamen, this prereward activity was highly selective for the specific visuomotor mapping that had just been performed, and this selectivity was maintained until the time of the reward. After performance reached an asymptote, the degree of this selectivity decreased markedly to the level typical for familiar visuomotor mappings. These findings support the hypothesis that neurons in the striatum play a pivotal role in associative learning.


Figures

Fig. 1
Fig. 1
Behavioral paradigm and task periods. The top row shows schematics of the video screen as each trial progressed. Each large square represents the video monitor and the small squares depict the four targets (not to scale). At the center of the screen, the fixation point (unfilled circle), the instruction stimulus, and a gray square appeared sequentially. The disappearance of the gray square served as the trigger stimulus. The rectangle beneath the screen represents the start bar and the position of the hand indicates the monkey’s starting position and response. Abbreviations: Del, delay; IS, instruction stimulus; Mov, movement; Prm, premovement period; Ref, reference period.
Fig. 2
Fig. 2
Performance curves. A–D. Proportion of correct responses with 95% confidence limits (shaded background) for novel, arbitrary visuomotor mappings to the four targets. Each curve is color coded for response target, according to the inset between C and D. The number of trials indicates the accumulated number of presentations of a given stimulus within a block of trials, regardless of the number of intervening stimuli that map to other targets. Note that, at the beginning of a session, the correct response and each of the three incorrect responses begin near the chance level of 25% (dashed horizontal line). E. Average and 95% confidence limit for the four curves in A–D. F. Average performance curve and 95% confidence limit for four concurrently learned mappings. The number of trials indicates the average over the entire session, with trials instructing familiar mappings eliminated. Abbreviations: LL, lower left; LR, lower right; UL, upper left; UR, upper right.
Fig. 3
Fig. 3
Composite population activity for PMd (blue) and putamen (red) for selected subpopulations of neurons. The activity rates represent modulation above baseline activity levels, and the black bar labeled “baseline” at the top left of the figure illustrates the interval used to calculate baseline activity. The arrows at the bottom indicate the alignment event for each population histogram. The early, middle, and late phases of learning (top three rows) correspond to trials prior to the learning criterion trial, during the fastest increase in performance, and during asymptotic performance, respectively. Population histograms for familiar visuomotor mappings appear in the bottom row. The asterisks at the top mark the task periods used to select cells with activity that increased significantly during learning. These four selected subpopulations contributed to all four rows for each column of population histograms, with the number of cells above each asterisk (blue numbers for PMd; red numbers for the putamen). The histograms aligned on target acquisition show activity for the same subpopulation of neurons as the histograms aligned on movement onset. The early, middle, and late learning phases were based on a mean of 4.9–5.2, 2.6–2.7, and 5.8–5.9 trials per cell, respectively, for PMd, depending on the column, and 4.8–5.1, 2.2–2.5, and 5.0–5.7 trials, respectively, for the putamen, also depending on the column. Familiar mappings were based on 7.0–7.3 trials per cell for PMd and 6.6–6.8 trials per cell for the putamen. Abbreviations: Del, delay; imp, impulses (spikes); IS, instruction stimulus; Mov, movement period; Mvt, movement; Prm, premovement period; Ref, reference period; TS, trigger stimulus.
Fig. 4
Fig. 4
Population histograms for the entire recorded population in PMd (blue, n = 120 cells) and putamen (red, n = 75 cells). All plots show modulations relative to baseline level, for correctly executed trials only, with the standard error indicated by the shaded background. The top, right plot shows baseline activity levels for the early (E), middle (M), and late (L) phases of learning, and for familiar mappings (F). The histograms are smoothed with a 7-point moving average. Arrows mark prominent features of the population histograms. The early, middle, and late learning phases were based on a mean of 4.7, 2.5, and 5.5 trials per cell, respectively, for PMd, and 4.4, 2.0, and 4.7 trials, respectively, for the putamen. Format as in Fig. 3.
Fig. 5
Fig. 5
Changes in the difference between activity for novel mappings during each phase of learning and activity for familiar mappings. Note that the activity during learning comes to differ less from that for familiar mappings as learning progressed. Data from Fig. 4, showing the average differences per 10-ms bin across the displays centered on IS onset, movement onset, and reward delivery (solid lines) and the peak difference (dashed lines).
Fig. 6
Fig. 6
Change in population activity in relation to performance for the IS-on period, PMd. This figure complements Fig. 4, which divides the data into discrete learning phases. Cells could have contributed to this average for more than one mapping, provided that its spatial tuning was sufficiently broad, but averages limited to the best mapping for each cell looked nearly identical. The background shading shows 95% confidence limits for both curves. Trial 0 is the learning criterion trial of Wirth et al. (2003) for each individual mapping (analogous to Fig. 2E), which often occurred one or two trials after the monkey reached that criterion for the stimulus set as a whole (analogous to Fig. 2F). The blue curve and background show the mean and 95% confidence limits for activity during the IS-on period as learning progressed. The gray curve and background show the performance rate and 95% confidence limit. The gray axis label is for the bar histogram, which shows the number of observations contributing to each point of the average. This number changes because of variation in learning rates and the duration that recording continued after the monkey had reached asymptotic performance.
Fig. 7
Fig. 7
Error effects for early task periods. Left: In the format of Fig. 4, population histograms for PMd (blue) and putamen (red) for correct (thin lines) and incorrect (thick lines) trials. Shaded background shows the standard error for those parts of the plot of interest (green arrows). The data points in the top, left show baseline activity during error trials for the early (E), middle (M), and late (L) phases of learning, and for familiar mappings (F). (For baseline activity during correct trials, see Fig. 4). Right: The differences between correct and incorrect trials for PMd (blue) and putamen (red). Green arrows mark features of interest. Errors were so rare for familiar mappings that the resulting population averages revealed little beyond the normal range of trial-to-trial variation. Abbreviations as in Fig. 3.
Fig. 8
Fig. 8
Error effects for late task periods. In the format of Fig. 7, except that the magenta arrow also marks a feature of interest. The inset above the curves for the late phase of learning (bottom row, left half) shows the standard error for the data marked by the magenta arrow, and the magenta lines indicate its time boundaries. Abbreviations as in Fig. 3.
Fig. 9
Fig. 9
Mapping selectivity (Si) during the pre-reward period. A, C. Data from PMd cells (n = 77) that had >5 impulses per second during the prereward period for any direction in any learning phase (early, middle, or late). Correctly executed trials only. B, D. Data from putamen cells (n = 39) selected according to the same criteria. Background shading shows the standard error. Activity was averaged within a 250 ms window, moved along the time axis in 10 ms steps. The computed Si was smoothed with a 31 ms gaussian in A and B, but appears without such smoothing in C and D. Abbreviation: rew, reward.
Electronic Supplementary Figure 1
Familiar-mapping data. Population histograms for the entire recorded population in PMd (blue, n = 120 cells) and putamen (red, n = 75 cells) in the format of Fig. 4, but for familiar-mapping trials divided according to the phase of learning the novel mappings in which they occurred. The early, middle, and late learning phases were based on a mean of 2.5, 0.7, and 3.8 trials, respectively, for PMd, and 2.0, 0.5, and 3.8 trials, respectively, for the putamen.
Electronic Supplementary Figure 2
Data from a second monkey, in the format of Fig. 9, putamen only. In this monkey, the delay between the touch of the screen and the reward was fixed period of 1.22 s.

References

    1. Asaad WF, Rainer G, Miller EK. Neural activity in the primate prefrontal cortex during associative learning. Neuron. 1998;21:1399–1407. - PubMed
    1. Bar-Gad I, Bergman H. Stepping out of the box: information processing in the neural networks of the basal ganglia. Curr Opin Neurobiol. 2001;11:689–695. - PubMed
    1. Bar-Gad I, Havazelet-Heimer G, Goldberg JA, Ruppin E, Bergman H. Reinforcement-driven dimensionality reduction--a model for information processing in the basal ganglia. J Basic Clin Physiol Pharmacol. 2000;11:305–320. - PubMed
    1. Barefoot HC, Baker HF, Ridley RM. Crossed unilateral lesions of temporal lobe structures and cholinergic cell bodies impair visual conditional and object discrimination learning in monkeys. Eur J Neurosci. 2002;15:507–516. - PubMed
    1. Barefoot HC, Maclean CJ, Baker HF, Ridley RM. Unilateral hippocampal and inferotemporal cortex lesions in opposite hemispheres impair learning of single-pair visual discriminations as well as visuovisual conditional tasks in monkeys. Behav Brain Res. 2003;141:51–62. - PubMed

Publication types