

MR imaging correlates of survival in patients with high-grade gliomas
- PMID: 16286386
- PMCID: PMC7976216
MR imaging correlates of survival in patients with high-grade gliomas
Abstract
Background and purpose: For patients with malignant gliomas, clinical data-including age, perioperative Karnofsky Performance Status (KPS), and tumor resection-and tumor imaging features-including necrosis and edema-have been found to correlate with survival. The purpose of this study was to assess the validity of these results and determine whether other imaging features are useful in predicting survival.
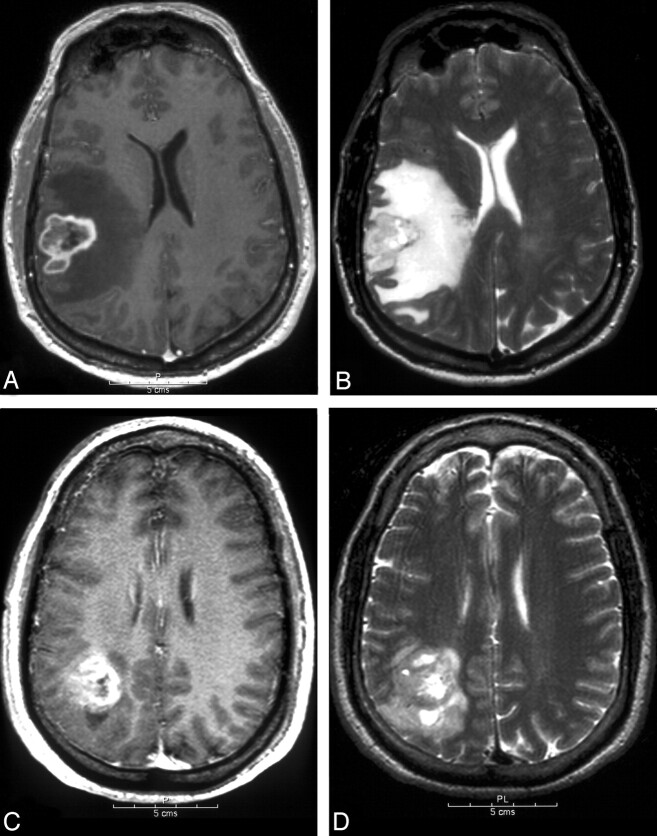
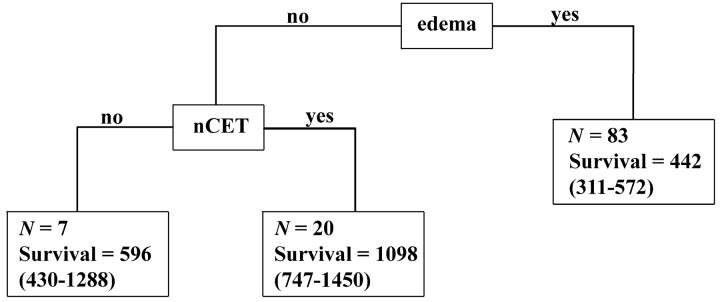
Methods: We analyzed the relationship between 15 imaging variables obtained from contrast-enhanced MR imaging scans and survival in patients with grade III (n = 43) and grade IV (n = 110) glioblastoma multiforme (GBM) gliomas. Image analysis was performed by 2 neuroradiologists who were blinded to clinical data. The Kaplan-Meier method was used to estimate survival probabilities. Univariable Cox models were used to assess the impact of imaging features on survival. A recursive partitioning analysis also was performed.
Results: As expected, age and KPS scores had significant prognostic value for both tumor grades. The extent of resection was not a statistically meaningful predictor of survival. For GBM, univariable analysis revealed the following imaging features to be significant, (hazard ratios in parentheses): noncontrast-enhancing tumor (nCET, 0.55), edema (1.62), satellites (1.74), and multifocality (4.34). For grade III tumors, the Cox hazard ratio for necrosis was 4.43 (P = .014) and correlated with a poor outcome and survival rates comparable to GBM patients. Lack of nCET, multifocality, and satellite lesions also were correlated with shortened survival.
Conclusion: Of 15 tumor imaging features in GBM patients, only nCET, edema, and multifocality/satellites are statistically significant prognostic indicators. The survival advantage of nCET is a novel finding.
Figures

References
-
- Mischel PS, Shai R, Shi T, et al. Identification of molecular subtypes of glioblastoma by gene expression profiling. Oncogene 2003;22:2361–2373 - PubMed
-
- Burger PC, Heinz ER, Shibata T, Kleihues P. Topographic anatomy and CT correlations in the untreated glioblastoma multiforme. J Neurosurg 1988;68:698–704 - PubMed
-
- Rees JH, Smirniotopoulos JG, Jones RV, Wong K. Glioblastoma multiforme: radiologic-pathologic correlation. Radiographics 1996;16:1413–1438; quiz 1462–1463 - PubMed
-
- Kowalczuk A, Macdonald RL, Amidei C, et al. Quantitative imaging study of extent of surgical resection and prognosis of malignant astrocytomas. Neurosurgery 1997;41:1028–1036; discussion 1036–1038 - PubMed
-
- Pierallini A, Bonamini M, Pantano P, et al. Radiological assessment of necrosis in glioblastoma: variability and prognostic value. Neuroradiology 1998;40:150–153 - PubMed
Publication types
MeSH terms
LinkOut - more resources
Full Text Sources
Other Literature Sources
Medical
Research Materials