

A novel approach for nontargeted data analysis for metabolomics. Large-scale profiling of tomato fruit volatiles
- PMID: 16286451
- PMCID: PMC1283752
- DOI: 10.1104/pp.105.068130
A novel approach for nontargeted data analysis for metabolomics. Large-scale profiling of tomato fruit volatiles
Abstract
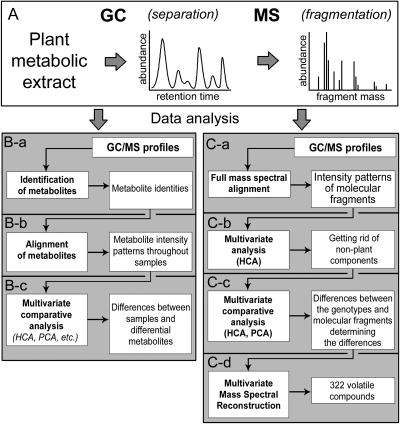
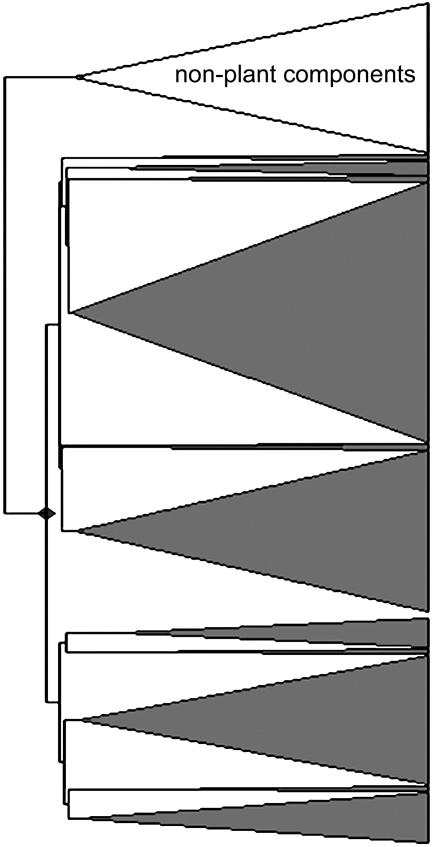
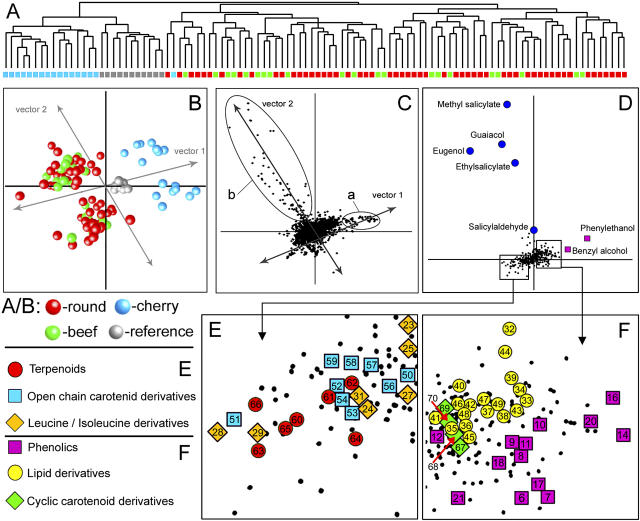
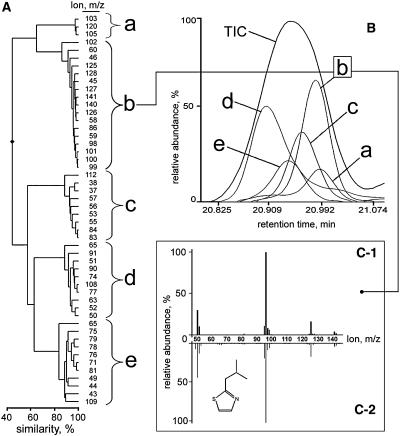
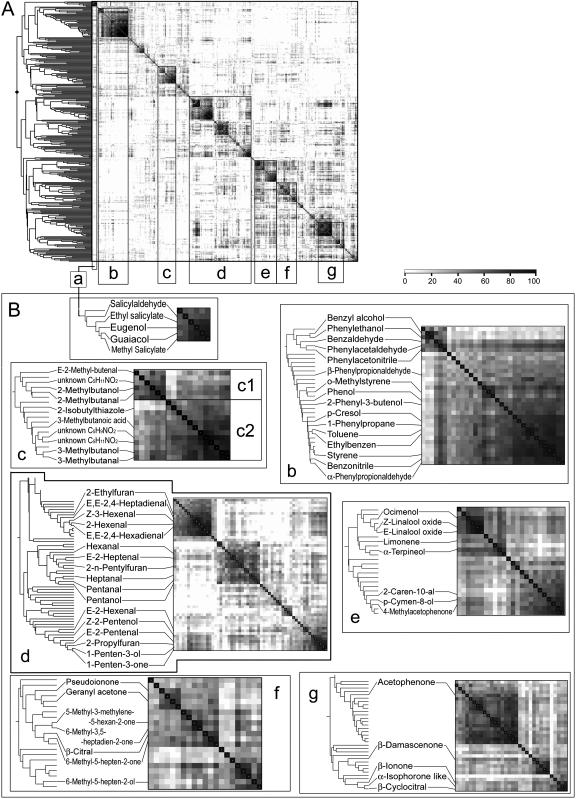
To take full advantage of the power of functional genomics technologies and in particular those for metabolomics, both the analytical approach and the strategy chosen for data analysis need to be as unbiased and comprehensive as possible. Existing approaches to analyze metabolomic data still do not allow a fast and unbiased comparative analysis of the metabolic composition of the hundreds of genotypes that are often the target of modern investigations. We have now developed a novel strategy to analyze such metabolomic data. This approach consists of (1) full mass spectral alignment of gas chromatography (GC)-mass spectrometry (MS) metabolic profiles using the MetAlign software package, (2) followed by multivariate comparative analysis of metabolic phenotypes at the level of individual molecular fragments, and (3) multivariate mass spectral reconstruction, a method allowing metabolite discrimination, recognition, and identification. This approach has allowed a fast and unbiased comparative multivariate analysis of the volatile metabolite composition of ripe fruits of 94 tomato (Lycopersicon esculentum Mill.) genotypes, based on intensity patterns of >20,000 individual molecular fragments throughout 198 GC-MS datasets. Variation in metabolite composition, both between- and within-fruit types, was found and the discriminative metabolites were revealed. In the entire genotype set, a total of 322 different compounds could be distinguished using multivariate mass spectral reconstruction. A hierarchical cluster analysis of these metabolites resulted in clustering of structurally related metabolites derived from the same biochemical precursors. The approach chosen will further enhance the comprehensiveness of GC-MS-based metabolomics approaches and will therefore prove a useful addition to nontargeted functional genomics research.
Figures
References
-
- Arimura G, Ozawa R, Nishioka T, Boland W, Koch T, Kuhnemann F, Takabayashi J (2002) Herbivore-induced volatiles induce the emission of ethylene in neighboring lima bean plants. Plant J 29: 87–98 - PubMed
-
- Augusto F, Valente ALP, dos Santos Tada E, Rivellino SR (2000) Screening of Brazilian fruit aromas using solid-phase microextraction-gas chromatography-mass spectrometry. J Chromatogr A 873: 117–127 - PubMed
-
- Baldwin EA, Goodner K, Plotto A, Protchett K, Einstein M (2004) Effect of volatiles and their concentration on perception of tomato descriptors. J Food Sci 69: 310–318
-
- Baldwin EA, Scott WJ, Shewmaker CK, Schuch W (2000) Flavor trivia and tomato aroma: biochemistry and possible mechanisms for control of important aroma components. HortScience 35: 1013–1022
-
- Bezman Y, Mayer F, Takeoka GR, Buttery RG, Ben-Oliel G, Rabinowitch HD, Naim M (2003) Differential effects of tomato (Lycopersicon esculentum Mill) matrix on the volatility of important aroma compounds. J Agric Food Chem 51: 722–726 - PubMed
Publication types
MeSH terms
LinkOut - more resources
Full Text Sources
Other Literature Sources
Miscellaneous
