. 2006 Jan 6;281(1):187-98.
doi: 10.1074/jbc.M509105200. Epub 2005 Nov 14.

Effects of stable suppression of Group VIA phospholipase A2 expression on phospholipid content and composition, insulin secretion, and proliferation of INS-1 insulinoma cells

Affiliations

Effects of stable suppression of Group VIA phospholipase A2 expression on phospholipid content and composition, insulin secretion, and proliferation of INS-1 insulinoma cells

Shunzhong Bao et al. J Biol Chem. .

Abstract

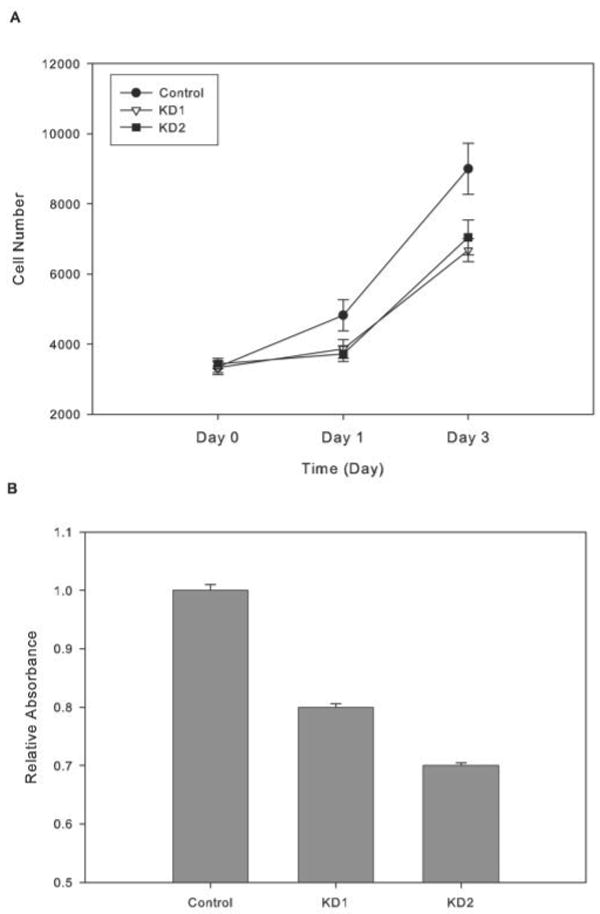
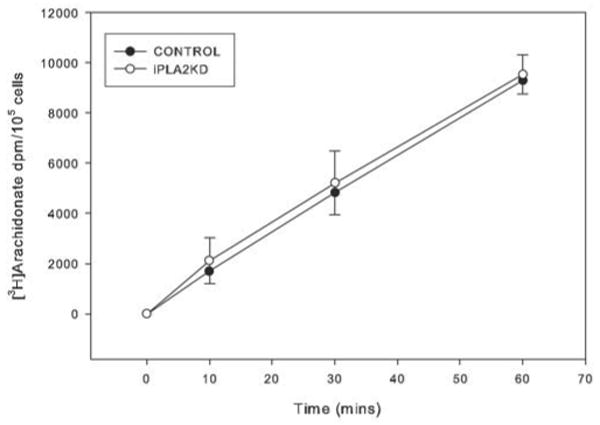
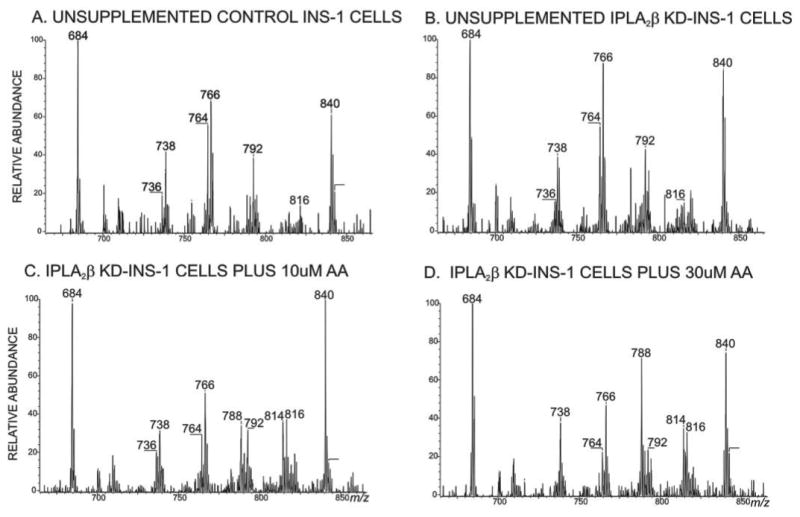
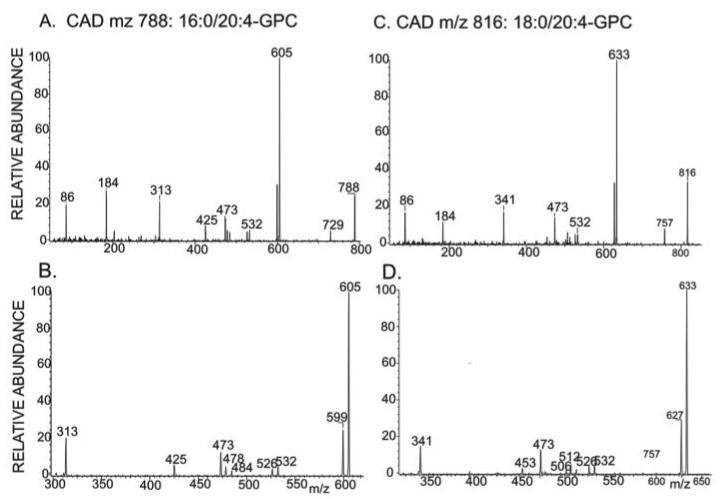
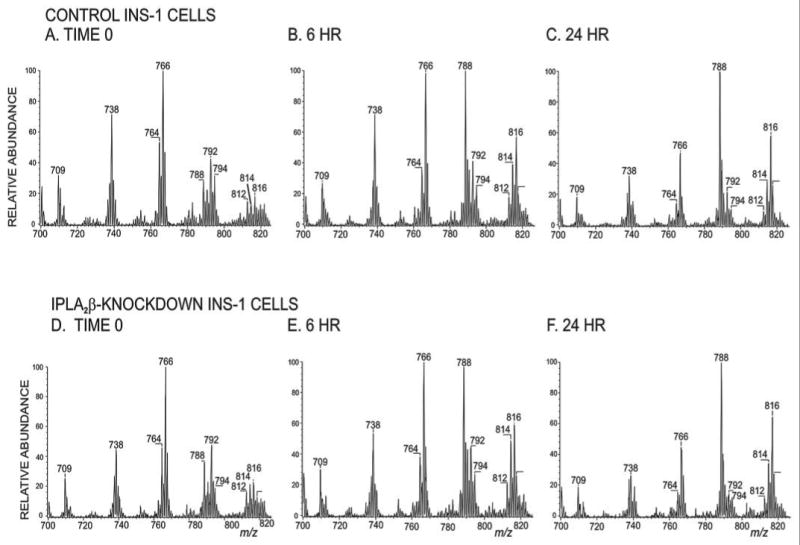
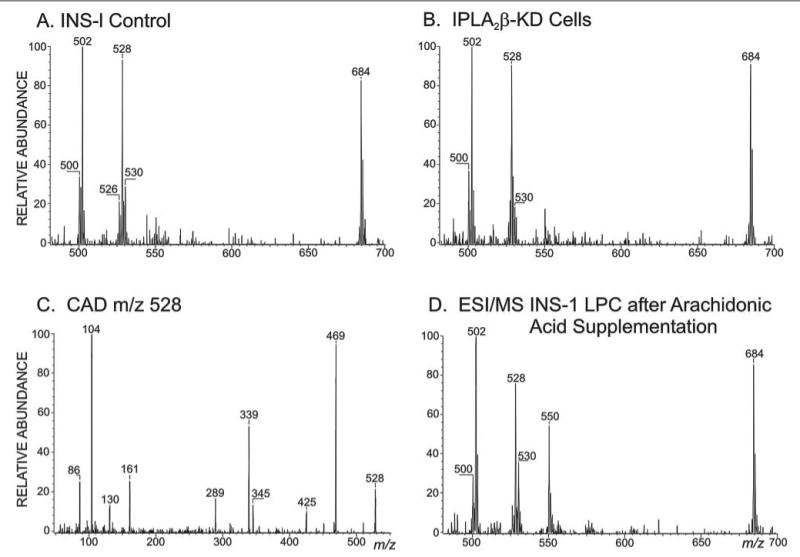
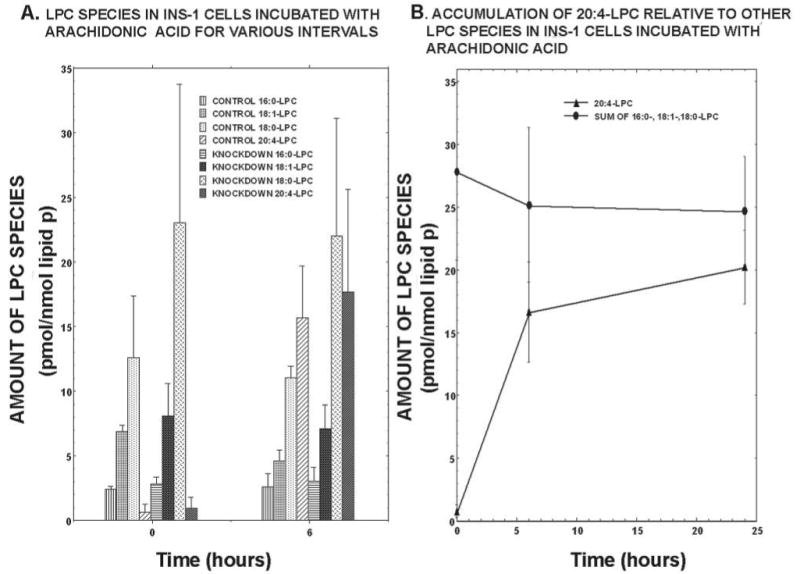
Studies involving pharmacologic inhibition or transient reduction of Group VIA phospholipase A2 (iPLA2beta) expression have suggested that it is a housekeeping enzyme that regulates cell 2-lysophosphatidylcholine (LPC) levels, rates of arachidonate incorporation into phospholipids, and degradation of excess phosphatidylcholine (PC). In insulin-secreting islet beta-cells and some other cells, in contrast, iPLA2beta signaling functions have been proposed. Using retroviral vectors, we prepared clonal INS-1 beta-cell lines in which iPLA2beta expression is stably suppressed by small interfering RNA. Two such iPLA2beta knockdown (iPLA2beta-KD) cell lines express less than 20% of the iPLA2beta of control INS-1 cell lines. The iPLA2beta-KD INS-1 cells exhibit impaired insulin secretory responses and reduced proliferation rates. Electrospray ionization mass spectrometric analyses of PC and LPC species that accumulate in INS-1 cells cultured with arachidonic acid suggest that 18:0/20:4-glycerophosphocholine (GPC) synthesis involves sn-2 remodeling to yield 16:0/20:4-GPC and then sn-1 remodeling via a 1-lyso/20:4-GPC intermediate. Electrospray ionization mass spectrometric analyses also indicate that the PC and LPC content and composition of iPLA2beta-KD and control INS-1 cells are nearly identical, as are the rates of arachidonate incorporation into PC and the composition and remodeling of other phospholipid classes. These findings indicate that iPLA2beta plays signaling or effector roles in beta-cell secretion and proliferation but that stable suppression of its expression does not affect beta-cell GPC lipid content or composition even under conditions in which LPC is being actively consumed by conversion to PC. This calls into question the generality of proposed housekeeping functions for iPLA2beta in PC homeostasis and remodeling.


Figures

FIGURE 1
FIGURE 1. Suppression of iPLA2β expression in iPLA2β knockdown INS-1 cells
INS-1 cell lines were prepared with retroviral vectors containing an insert encoding scrambled RNA (control) or siRNA against iPLA2β mRNA to generate iPLA2β knockdown cell lines, and iPLA2β mRNA was analyzed by Northern blots (A, lane 1, vector control; lane 2, iPLA2β-KD1; lane 3, iPLA2β-KD2; lane 4, parental cells) and real time PCR (B). Activity of iPLA2β (C) was measured without Ca2+ in the presence of EGTA and without (open bars) or with 1 mm ATP alone (cross-hatched bars) or with ATP and 10μm BEL (solid bars). The leftmost bar (B) or set of bars (C) reflects control cells, and the center and rightmost bar or set of bars reflects iPLA2β-KD1 and iPLA2β-KD2 cells, respectively.
FIGURE 2
FIGURE 2. Effects of glucose and the adenylyl cyclase activator forskolin on insulin secretion from iPLA2β knockdown and control INS-1 cells
Insulin secretion by control, iPLA2β-KD1, and iPLA2β-KD2 INS-1 cells was measured after a 1-h incubation in medium containing 3 or 20mm glucose without or with 2.5 μm forskolin. Mean values ± S.E. (n = 6) normalized to cell protein content are displayed. Values for iPLA2β-KD INS-1 cells were significantly lower (p < 0.05) than control under all conditions.
FIGURE 3
FIGURE 3. Rates of proliferation of control and iPLA2β knockdown INS-1 cells
INS-1 cells (0.3 × 10⁶ cells/well) were cultured (37 °C) for various intervals and then detached with trypsin/EGTA solution, and cell number was determined from fluorescence enhancement upon association of CyQuant indicator with DNA (A) or from BrdUrd incorporation (B). Mean values ± S.E. are indicated (n = 6). Values for iPLA2β-KD1 and iPLA2β-KD2 cells were significantly lower (p < 0.05) than control at 1 and 3 days.
FIGURE 4
FIGURE 4. Time course of [3H]arachidonic acid incorporation into INS-1 cell phospholipids
Control (closed symbols) or iPLA2β-KD (open symbols) INS-1 cells were preincubated (30 min, 37 °C) and then incubated with [3H]arachidonic acid for 10–60 min. The 3H content of extracted phospholipids was then determined and expressed as dpm/105 cells (n = 6).
FIGURE 5
FIGURE 5. Electrospray ionization mass spectrometric analyses of INS-1 cell glycerophosphocholine lipids
Phospholipids from control (A) or iPLA2β-KD1 INS-1 cells (B) were analyzed as Li+ adducts by positive ion ESI/MS. In C and D, iPLA2β-KD1 INS-1 cells were incubated for 24 h with 10 or 30 μm supplemental arachidonic acid, respectively, in the culture medium before lipids were extracted and analyzed.
FIGURE 6
FIGURE 6. Tandem mass spectra of arachidonate-containing glycerophosphocholine lipids in INS-1 cells cultured with arachidonic acid
GPC lipid-Li+ adducts from control or iPLA2β-KD1 INS-1 cells incubated for 24 h with arachidonic acid were analyzed by positive ion ESI/MS/MS. In A and B, the ion m/z 788 was subjected to CAD, and product ions were analyzed. A, ions from m/z 50 to 800; B, displays ions from m/z 300 to 620. In C and D, the ion at m/z 816 was subjected to CAD, and product ions were analyzed and displayed as above.
FIGURE 7
FIGURE 7. Electrospray ionization mass spectrometric analyses of glycerophosphocholine lipids in iPLA2β knockdown and control INS-1 cells incubated with arachidonic acid for various intervals
Control (A–C) or iPLA2β-KD (D–F) INS-1 cells were incubated with arachidonic acid for 0 h (A and D), 6 h (B and E), or 24 h (C and F). Extracted GPC lipid-Li+ adducts were analyzed by positive ion ESI/MS/MS scanning for constant neutral loss of 183.
FIGURE 8
FIGURE 8. Time course and concentration dependence of appearance of arachidonate-containing glycerophosphocholine lipids in INS-1 cells incubated with arachidonic acid
Control (closed symbols) or iPLA2β-KD INS-1 cells (open symbols) were incubated with 70 μm arachidonic acid for 0, 6, or 24 h (A) or with varied concentrations (0, 1, 5, 10, 30, or 70 μm) arachidonic acid for 24 h (B). Extracted GPC lipids were analyzed as Li+ adducts by positive ion ESI/MS. The fraction of total ion current represented by 16:0/20:4-GPC (m/z 788), 18:1/20:4-GPC (m/z 814), and 18:0/20:4-GPC (m/z 816) was then determined for each condition. Displayed values are mean ± S.E. (n = 6). No values were significantly different between control and iPLA2β-KD INS-1 cells except for the arachidonate incorporation value at 5 μm arachidonate in B (p < 0.05).
FIGURE 9
FIGURE 9. Electrospray ionization mass spectrometric analyses of INS-1 cell lysophosphatidylcholine species
Extracted lipids from control (A) or iPLA2β-KD1 INS-1 cells (B) at time 0 or after 24 h (D) of incubation with arachidonic acid were analyzed as Li+ adducts by positive ion ESI/MS/MS for neutral loss of 59. In C, the ion m/z 528 from ESI/MS analyses in A or B was subjected to CAD, and product ions were analyzed. D, the ESI/MS/MS constant neutral loss of 59 scan for LPC from INS-1 cells incubated for 24 h with arachidonic acid.
FIGURE 10
FIGURE 10. Tandem mass spectra of arachidonate containing lysophosphatidylcholine species from INS-1 cells cultured with arachidonic acid and of standard (1-arachidonoyl, 2-lyso)-sn-glycerophosphocholine
Extracted lipids from control or iPLA2β-KD1 INS-1 cells incubated for 24 h with arachidonic acid were analyzed as Li+ adducts by positive ion ESI/MS/MS, the ion m/z 550 was subjected to CAD, and its product ions were analyzed. A, the spectrum obtained with fresh extracts; B, the spectrum obtained after the extract had been stored for 2 weeks. C, the tandem spectrum of standard 1-arachidonoyl, 2-lyso-GPC prepared from 20:4/20:4-GPC with N. naja phospholipase A2
FIGURE 11
FIGURE 11. Time course of appearance of lysophosphatidylcholine species in INS-1 cells incubated with arachidonic acid
The phosphorus contents of lipid extracts from control or iPLA2β-KD1 INS-1 cells after 0, 6, or 24 h of incubation with arachidonic acid were measured, and internal standard 14:0/14:0-GPC was added. LPC-Li+ adducts were analyzed by positive ion ESI/MS/MS for constant neutral loss of 59. LPC species were measured by determining the ion current for 16:0-LPC (m/z 502), 18:1-LPC (m/z 528), 18:0-LPC (m/z 530), and 20:4-LPC (m/z 550) relative to that for the internal standard (m/z 684) and interpolating from a standard curve. Values are normalized to lipid phosphorus. In A, the leftmost four bars at 0 and 6 h represent LPC analytes in control INS-1 cells, and the rightmost four bars at each time represent those from iPLA2β-KD cells. In B, the closed triangles represent 20:4-LPC, and the closed circles represent the sum of 16:0-, 18:1-, and 18:0-LPC.
FIGURE 12
FIGURE 12. Negative ion electrospray ionization mass spectrometric analyses of anionic glycerophospholipids in iPLA2β knockdown and control INS-1 cells incubated with arachidonic acid
The lipid phosphorus content was measured in extracts from iPLA2β-KD (A and B) or control (C and D) INS-1 cells incubated with arachidonic acid for 0 h (A and C) or 24 h (B and D); internal standard 14:0/14:0-GPE was added; and the mixture was analyzed by negative ion ESI/MS.

References

    1. Six DA, Dennis EA. Biochim Biophys Acta. 2000;1488:1–19. - PubMed
    1. Ma Z, Turk J. Prog Nucleic Acids Res Mol Biol. 2001;67:1–33. - PubMed
    1. Brash AR. J Clin Invest. 2001;107:1339–1345. - PMC - PubMed
    1. Radu CG, Yang LV, Riedinger M, Au M, Witte ON. Proc Natl Acad Sci U S A. 2004;101:245–250. - PMC - PubMed
    1. Murphy RC, Sala A. Methods Enzymol. 1990;187:90–98. - PubMed

Publication types

MeSH terms