

The stress-regulated protein M6a is a key modulator for neurite outgrowth and filopodium/spine formation
- PMID: 16286650
- PMCID: PMC1287971
- DOI: 10.1073/pnas.0504262102
The stress-regulated protein M6a is a key modulator for neurite outgrowth and filopodium/spine formation
Abstract
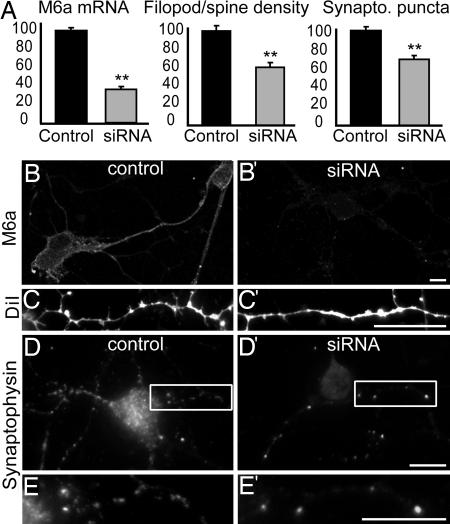
Neuronal remodeling is a fundamental process by which the brain responds to environmental influences, e.g., during stress. In the hippocampus, chronic stress causes retraction of dendrites in CA3 pyramidal neurons. We have recently identified the glycoprotein M6a as a stress-responsive gene in the hippocampal formation. This gene is down-regulated in the hippocampus of both socially and physically stressed animals, and this effect can be reversed by antidepressant treatment. In the present work, we analyzed the biological function of the M6a protein. Immunohistochemistry showed that the M6a protein is abundant in all hippocampal subregions, and subcellular analysis in primary hippocampal neurons revealed its presence in membrane protrusions (filopodia/spines). Transfection experiments revealed that M6a overexpression induces neurite formation and increases filopodia density in hippocampal neurons. M6a knockdown with small interference RNA methodology showed that M6a low-expressing neurons display decreased filopodia number and a lower density of synaptophysin clusters. Taken together, our findings indicate that M6a plays an important role in neurite/filopodium outgrowth and synapse formation. Therefore, reduced M6a expression might be responsible for the morphological alterations found in the hippocampus of chronically stressed animals. Potential mechanisms that might explain the biological effects of M6a are discussed.
Figures


Similar articles
-
Cysteine residues in the large extracellular loop (EC2) are essential for the function of the stress-regulated glycoprotein M6a.J Biol Chem. 2009 Nov 13;284(46):32075-88. doi: 10.1074/jbc.M109.012377. Epub 2009 Sep 8. J Biol Chem. 2009. PMID: 19737934 Free PMC article.
-
Neuronal filopodium formation induced by the membrane glycoprotein M6a (Gpm6a) is facilitated by coronin-1a, Rac1, and p21-activated kinase 1 (Pak1).J Neurochem. 2016 Apr;137(1):46-61. doi: 10.1111/jnc.13552. Epub 2016 Feb 22. J Neurochem. 2016. PMID: 26809475
-
Tyrosine 251 at the C-terminus of neuronal glycoprotein M6a is critical for neurite outgrowth.J Neurosci Res. 2015 Feb;93(2):215-29. doi: 10.1002/jnr.23482. Epub 2014 Sep 19. J Neurosci Res. 2015. PMID: 25242528
-
Stress and the developing hippocampus: a double-edged sword?Mol Neurobiol. 2003 Apr;27(2):121-36. doi: 10.1385/MN:27:2:121. Mol Neurobiol. 2003. PMID: 12777683 Free PMC article. Review.
-
Hippocampal formation: shedding light on the influence of sex and stress on the brain.Brain Res Rev. 2007 Oct;55(2):343-55. doi: 10.1016/j.brainresrev.2007.02.006. Epub 2007 Feb 28. Brain Res Rev. 2007. PMID: 17395265 Free PMC article. Review.
Cited by
-
Effects of chronic stress on prefrontal cortex transcriptome in mice displaying different genetic backgrounds.J Mol Neurosci. 2013 May;50(1):33-57. doi: 10.1007/s12031-012-9850-1. Epub 2012 Jul 27. J Mol Neurosci. 2013. PMID: 22836882 Free PMC article.
-
Reduction of acute mild stress corticosterone response and changes in stress-responsive gene expression in male Balb/c mice after repeated administration of a Rhodiola rosea L. root extract.Food Sci Nutr. 2019 Oct 22;7(11):3827-3841. doi: 10.1002/fsn3.1249. eCollection 2019 Nov. Food Sci Nutr. 2019. PMID: 31763032 Free PMC article.
-
Proteomic investigation of the ventral rat hippocampus links DRP-2 to escitalopram treatment resistance and SNAP to stress resilience in the chronic mild stress model of depression.J Mol Neurosci. 2007;32(2):132-44. doi: 10.1007/s12031-007-0025-4. J Mol Neurosci. 2007. PMID: 17873297
-
In Vivo and In Vitro Neuronal Plasticity Modulation by Epigenetic Regulators.J Mol Neurosci. 2018 Jul;65(3):301-311. doi: 10.1007/s12031-018-1101-7. Epub 2018 Jun 22. J Mol Neurosci. 2018. PMID: 29931501
-
Myofibroblastic Conversion and Regeneration of Mesothelial Cells in Peritoneal and Liver Fibrosis.Am J Pathol. 2015 Dec;185(12):3258-73. doi: 10.1016/j.ajpath.2015.08.009. Am J Pathol. 2015. PMID: 26598235 Free PMC article.
References
-
- Kendler, K. S., Karkowski, L. M. & Prescott, C. A. (1999) Am. J. Psychiatry 156, 837-841. - PubMed
-
- Watanabe, Y., Gould, E. & McEwen, B. S. (1992) Brain Res. 588, 341-345. - PubMed
-
- Sandi, C., Davies, H. A., Cordero, M. I., Rodriguez, J. J., Popov, V. I. & Stewart, M. G. (2003) Eur. J. Neurosci. 17, 2447-2456. - PubMed
-
- Sousa, N., Lukoyanov, N. V., Madeira, M. D., Almeida, O. F. & Paula-Barbosa, M. M. (2000) Neuroscience 97, 253-266. - PubMed
Publication types
MeSH terms
Substances
LinkOut - more resources
Full Text Sources
Other Literature Sources
Molecular Biology Databases
Miscellaneous
