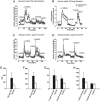
. 2005 Nov 22;102(47):17020-5.
doi: 10.1073/pnas.0503219102. Epub 2005 Nov 14.

Transthyretin constitutes a functional component in pancreatic beta-cell stimulus-secretion coupling

Affiliations

Transthyretin constitutes a functional component in pancreatic beta-cell stimulus-secretion coupling

Essam Refai et al. Proc Natl Acad Sci U S A. .

Abstract

Transthyretin (TTR) is a transport protein for thyroxine and, in association with retinol-binding protein, for retinol, mainly existing as a tetramer in vivo. We now demonstrate that TTR tetramer has a positive role in pancreatic beta-cell stimulus-secretion coupling. TTR promoted glucose-induced increases in cytoplasmic free Ca(2+) concentration ([Ca(2+)](i)) and insulin release. This resulted from a direct effect on glucose-induced electrical activity and voltage-gated Ca(2+) channels. TTR also protected against beta-cell apoptosis. The concentration of TTR tetramer was decreased, whereas that of a monomeric form was increased in sera from patients with type 1 diabetes. The monomer was without effect on glucose-induced insulin release and apoptosis. Thus, TTR tetramer constitutes a component in normal beta-cell function. Conversion of TTR tetramer to monomer may be involved in the development of beta-cell failure/destruction in type 1 diabetes.


Figures
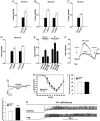
Fig. 1.
Fig. 1.
Effects of TTR on [Ca2+]i, voltage-gated Ca2+ currents, and membrane potential. (A and C) Cells incubated with total TTR. (B and D) Cells incubated with the monomer. (A and B) The Δ increase in [Ca2+]i is shown when cells were stimulated with glucose. (A) n = 64 for control cells and 82 for TTR-treated cells. (B) n = 50 for control cells and 73 for cells treated with 1 μg/ml TTR monomer, and n = 50 for control cells and 47 for cells treated with 2 μg/ml TTR monomer. (C and D) The Δ increase in [Ca2+]i is shown when cells were depolarized with KCl. (C) n = 71 for control cells and 90 for TTR treated cells. (D) n = 83 for control cells and 83 for cells treated with 1 μg/ml TTR, and n = 83 for control cells and 60 for cells treated with 2 μg/ml TTR. (E) Cells incubated with total TTR and anti-TTR. Δ increases in [Ca2+]i are shown when cells are stimulated with glucose (n = 37 for control cells, n = 22 for TTR-treated cells, and n = 52 for TTR and anti-TTR-treated cells) and depolarized with KCl (n = 89 for control cells, n = 24 for TTR-treated cells, and n = 42 for TTR and anti-TTR-treated cells). (F) Representative traces showing the effects of glucose and KCl on [Ca2+]i in cells incubated with TTR (upper trace) and control cells (lower trace). (G) Sample whole-cell Ca2+ current traces generated by a depolarizing voltage pulse (100 ms) to -20 mV from a holding potential of -70 mV from a control cell (upper trace) and a cell incubated with TTR (lower trace). (H) Whole-cell Ca2+ current-voltage relationships in pancreatic β-cells in the presence and absence of TTR. The TTR-treated β-cells (n = 45) displayed larger Ca2+ currents than control cells (n = 50) when they were depolarized to -20 mV. (I) No significant difference in the resting membrane potential was detected between control cells (n = 21) and cells treated with TTR (n = 17). (J) TTR-treated cells (n = 17) exhibited a significantly faster action potential frequency than control cells (n = 21). **, P < 0.01 versus control. (K) Samples of membrane potential traces recorded from a control cell (Upper) and a cell incubated with TTR overnight (Lower). There was a more frequent firing of action potentials in cells incubated with TTR compared with control cells. **, P < 0.01 and ***, P < 0.001.
Fig. 2.
Fig. 2.
Effects of total TTR and TTR monomer on insulin secretion. Insulin release was measured in mouse β-cells preincubated with total TTR at 150 mg/liter (n = 5) (A), 1 μg/ml TTR monomer (n = 3) (C), and 2 μg/ml TTR monomer (n = 3) (D). (B) A representative trace (n = 3) for insulin release measured in human islets exposed to 150 mg/liter TTR. μU, microunits. (E-H) The insulin release from A, C, and D expressed as area under the curve for basal (E and G) and glucose-stimulated (F and H) secretion. *, P < 0.05.
Fig. 3.
Fig. 3.
SDS/PAGE pattern of TTR. Commercial TTR run on HPLC with a Vydac (Hesperia, CA) C18 column, acetonitrile in 0.1% trifluoroacetic acid; gradient 20-60% in 30 min. AU, absorbance units at wavelength 214 nm. (Inset) Fractions 1-3 were collected and run on SDS/PAGE, where std refers to the commercial TTR before HPLC run.
Fig. 4.
Fig. 4.
SDS/PAGE of sera from adults and children with T1D and healthy controls and effect of total TTR and TTR monomer in the presence or absence of apoCIII on cell death. (A) Five T1D sera (d) and one control serum (c) from adults. (B) Sera from two children with TID (d) and two control children (c). The band for the monomeric form of TTR is marked with an arrow. In both A and B, samples with commercial TTR and a broad-range marker (m) were run. (C and D) FACS analysis of pancreatic β-cells exposed to total TTR (C) or TTR monomer (D) in the presence or absence of apoCIII or apoCIII alone (n = 5). Cell death is expressed as the percentage of 10,000 counted cells. **, P < 0.01 and ***, P < 0.001.

Similar articles

Cited by

References

    1. Jacobsson, B., Carlstrom, A., Platz, A. & Collins, V. P. (1990) J. Clin. Endocrinol. Metab. 71, 875-880. - PubMed
    1. Itoh, N., Hanafusa, T., Miyagawa, J., Tamura, S., Inada, M., Kawata, S., Kono, N. & Tarui, S. (1992) J. Clin. Endocrinol. Metab. 74, 1372-1377. - PubMed
    1. Sousa, M. M., Berglund, L. & Saraiva, M. J. (2000) J. Lipid Res. 41, 58-65. - PubMed
    1. Pettersson, T., Carlstrom, A. & Jörnvall, H. (1987) Biochemistry 26, 4572-4583. - PubMed
    1. Blake, C. C., Geisow, M. J., Oatley, S. J., Rerat, B. & Rerat, C. (1978) J. Mol. Biol. 121, 339-356. - PubMed

Publication types