. 2005 Nov 21;202(10):1375-86.
doi: 10.1084/jem.20050855. Epub 2005 Nov 14.

Sequential development of interleukin 2-dependent effector and regulatory T cells in response to endogenous systemic antigen

Affiliations

Sequential development of interleukin 2-dependent effector and regulatory T cells in response to endogenous systemic antigen

Birgit Knoechel et al. J Exp Med. .

Abstract

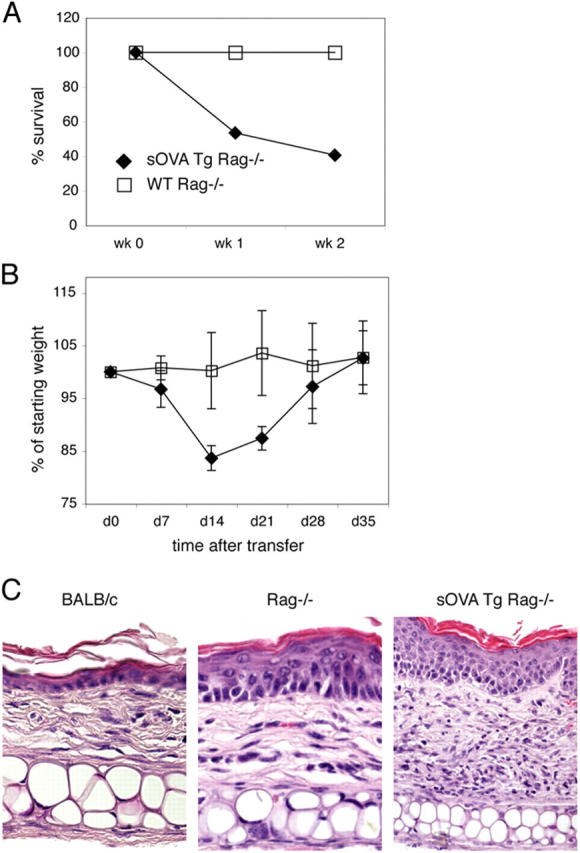
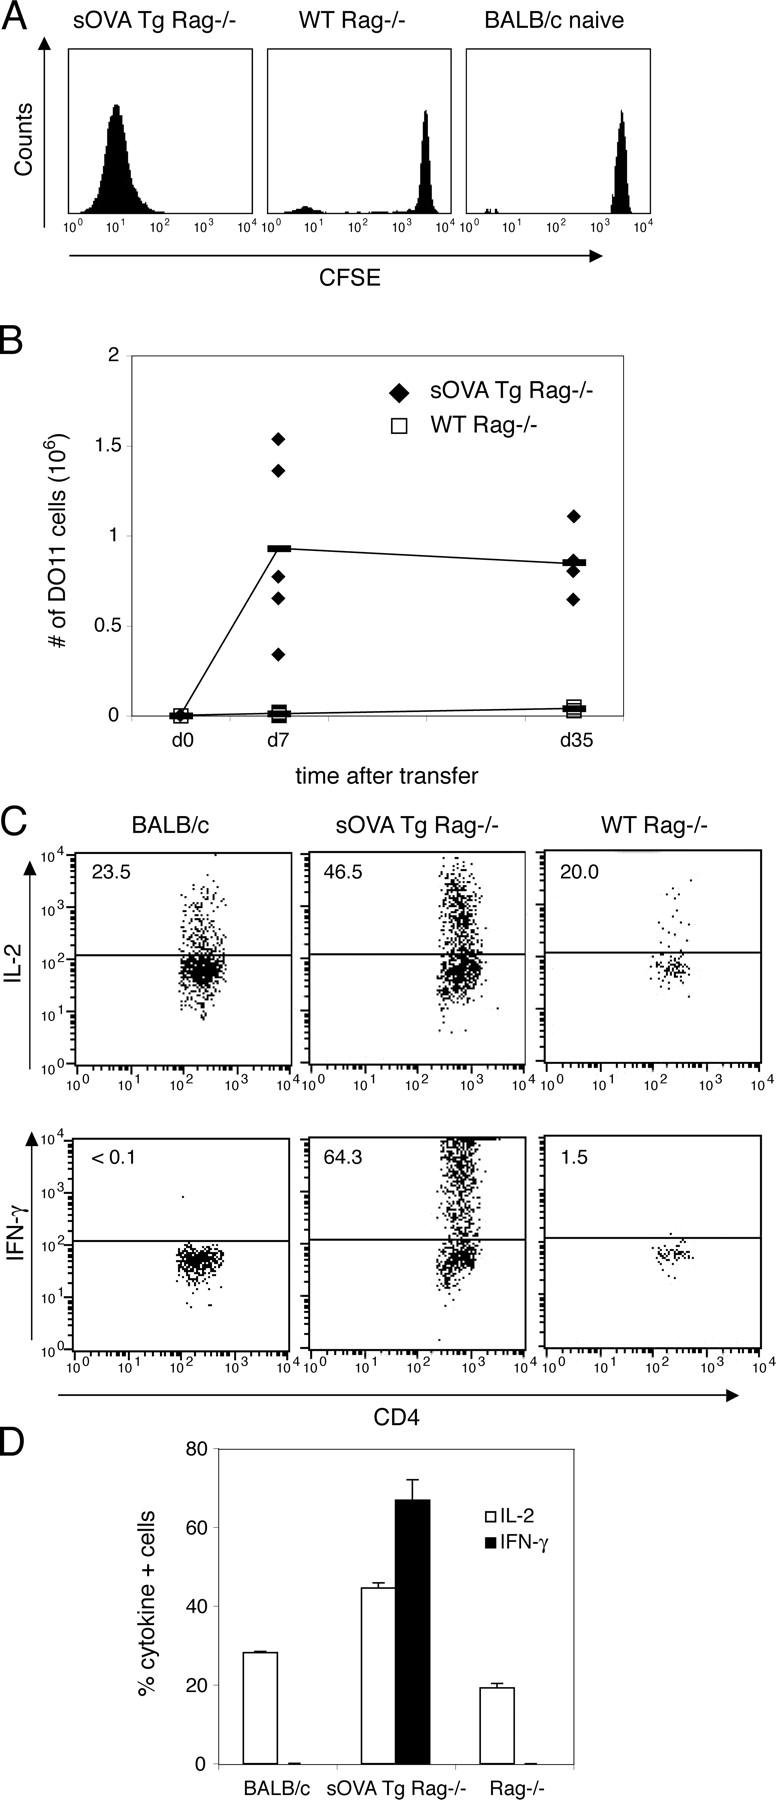
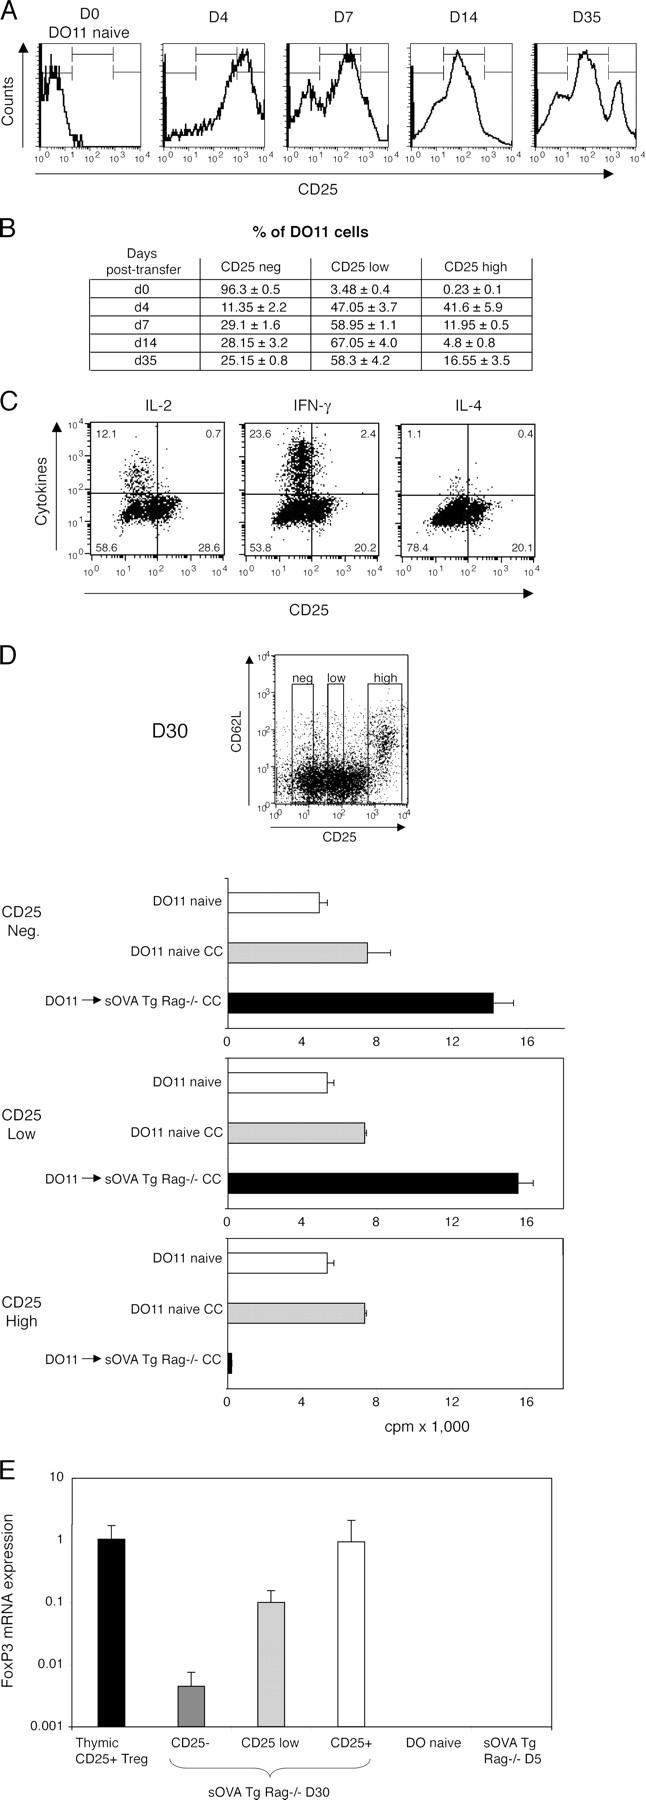
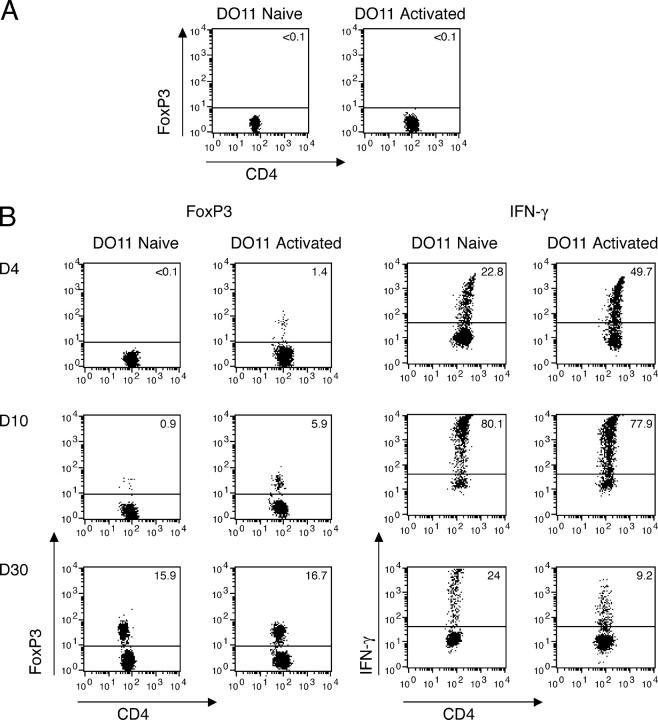
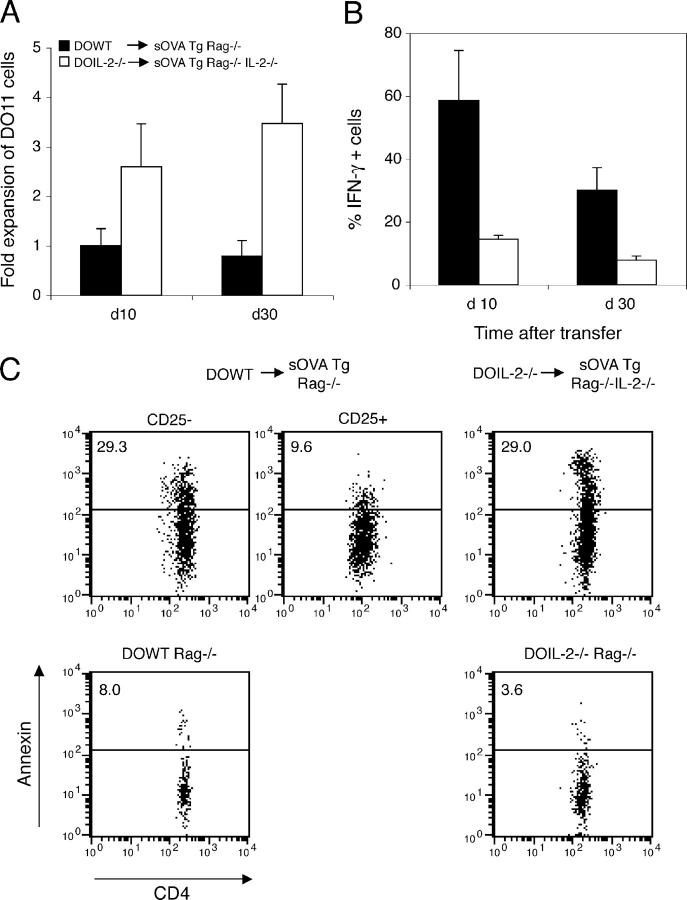
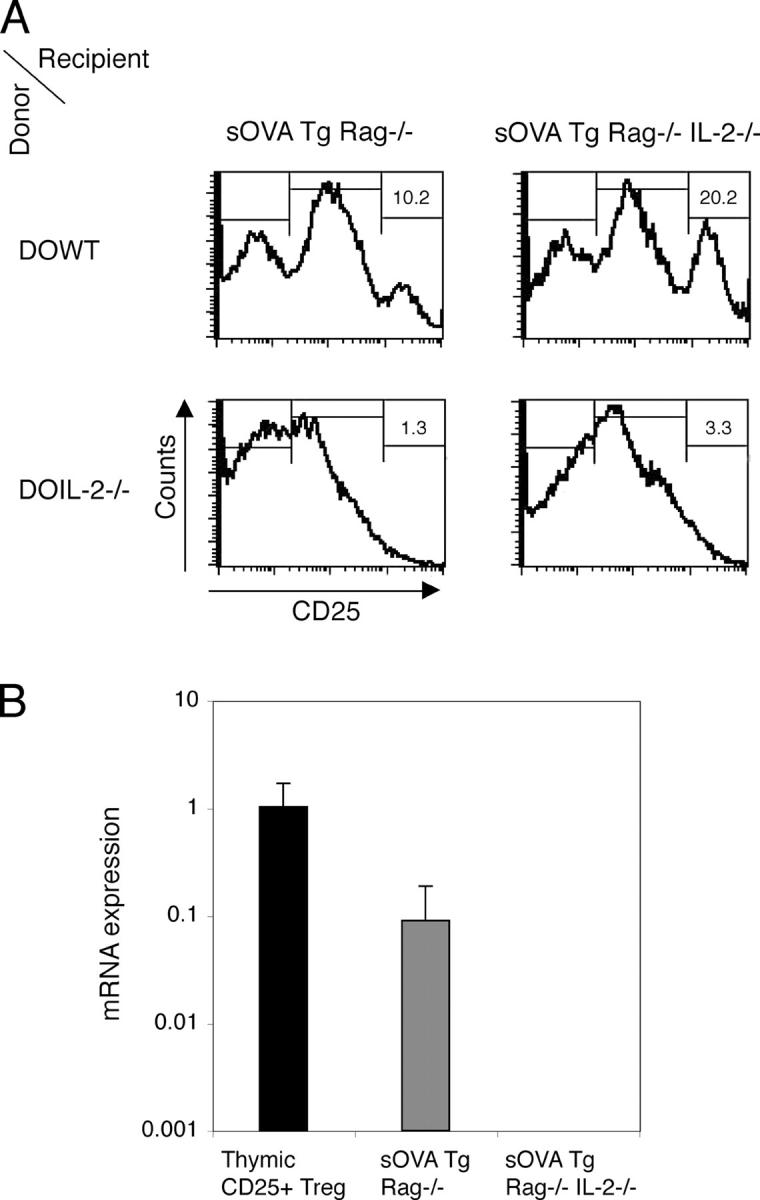
Transfer of naive antigen-specific CD4(+) T cells into lymphopenic mice that express an endogenous antigen as a systemic, secreted protein results in severe autoimmunity resembling graft-versus-host disease. T cells that respond to this endogenous antigen develop into effector cells that cause the disease. Recovery from this disease is associated with the subsequent generation of FoxP3(+)CD25(+) regulatory cells in the periphery. Both pathogenic effector cells and protective regulatory cells develop from the same antigen-specific T cell population after activation, and their generation may occur in parallel or sequentially. Interleukin (IL)-2 plays a dual role in this systemic T cell reaction. In the absence of IL-2, the acute disease is mild because of reduced T cell effector function, but a chronic and progressive disease develops late and is associated with a failure to generate FoxP3(+) regulatory T (T reg) cells in the periphery. Thus, a peripheral T cell reaction to a systemic antigen goes through a phase of effector cell-mediated pathology followed by T reg cell-mediated recovery, and both require the growth factor IL-2.


Figures

Figure 1.
Figure 1.
Lymphopenia promotes a systemic autoimmune reaction. 106 purified CD4+ DO11 Rag−/− T cells were transferred into sOVA Tg Rag−/− or nontransgenic Rag−/− mice on day 0. (A) Survival is plotted over time as the percentage of surviving mice from three experiments with four to seven mice per each group. (B) Body weight is plotted over time as the percentage of the starting weight before T cell transfer. Data are pooled from six to eight mice per group. In this analysis, only mice that survived were included. Values represent means ± SD. (C) Paraffin sections of the ear skin of BALB/c control, Rag−/−, and sOVA Tg Rag−/− mice 7 d after T cell transfer were stained with H&E.
Figure 2.
Figure 2.
Expansion of antigen-recognizing T cells in lymphocyte-deficient recipients. 106 purified CD4+ DO11 Rag−/− cells labeled with CFSE were transferred into sOVA Tg Rag−/− mice, nontransgenic Rag−/− mice, or normal BALB/c recipients on day 0. (A) Peripheral lymph nodes were harvested 5 d after transfer, and the CFSE profile of gated KJ1-26+CD4+ cells was determined by flow cytometric analysis. (B) Peripheral lymph nodes were harvested at the indicated time points after transfer, and the total number of DO11 cells was determined by counting and a flow cytometric analysis of KJ1-26+CD4+ cells. Data are pooled from three experiments (n = 5, sOVA Tg Rag−/−; n = 9, Rag−/−). The horizontal lines indicate means. (C) Peripheral lymph node cells were harvested on day 4 after transfer, restimulated with OVA peptide and APCs, and stained for intracellular cytokines. All plots are gated on KJ1-26+CD4+ cells. Numbers refer to the percentage of cytokine-positive cells. Representative plots are shown from one experiment out of four with two mice per group. (D) Data are expressed as the percentage of cytokine-positive gated KJ1-26+CD4+ cells pooled from two mice per group from one representative experiment. Values represent means ± SD.
Figure 3.
Figure 3.
Peripheral development of effector cells and T reg cells. 106 CD4+-purified DO11 Rag−/− cells were transferred into sOVA Tg Rag−/− mice on day 0. (A) Peripheral lymph nodes were harvested at the indicated time points after transfer and analyzed for expression of KJ1-26+CD4+CD25+ cells by flow cytometry. Histograms show CD25 expression gated on KJ1-26+CD4+ cells from one representative mouse out of three experiments. (B) The table summarizes data pooled from two mice per group, based on gates shown in A. (C) Lymph node cells were harvested 30 d after transfer, restimulated with OVA peptide and APCs, and stained for intracellular cytokines. CD25 staining was done before permeabilization. All plots are gated on KJ1-26+CD4+ cells. Representative plots are shown from one experiment out of four with two mice per group. (D) Peripheral lymph node cells were harvested on day 30 after transfer and sorted for KJ1-26+CD4+ and negative (Neg.), intermediate (Low), or high (High) levels of CD25 expression as indicated in the FACS plot. The cells were co-cultured (CC) with sorted naive KJ1-26+CD4+CD25 cells from DO11 Rag−/− mice, and [3H]thymidine incorporation was assayed on day 3. (E) Lymph node and spleen cells from sOVA Tg Rag−/− mice at day 30 after transfer were sorted on KJ1-26+CD4+CD25 negative (−), low, and high (+) expression and analyzed for FoxP3 mRNA by real-time fluorogenic RT-PCR. Thymic- generated KJ1-26+CD4+CD25+ cells from DO11 × RIP-mOVA mice were included as a positive control; naive DO11 Rag−/− and KJ1-26+CD4+ cells recovered from sOVA Tg Rag−/− mice on day 5 were included as negative controls. Data are pooled from two experiments. Values in D and E represent means ± SD.
Figure 4.
Figure 4.
T reg cells develop more rapidly from activated than from naive DO11 cells. Purified CD4+ DO11 Rag−/− cells were stimulated on mitomycin C–treated splenocytes in the presence of 1 μg/ml OVA peptide for 4 d. 106 in vitro–activated DO11 Rag−/− or naive DO11 Rag−/− cells were transferred into sOVA Tg Rag−/− on day 0. (A) FoxP3 expression of naive and in vitro–activated DO11 Rag−/− cells before transfer. (B) Splenocytes were harvested 4, 10, and 30 d after transfer. FoxP3 expression of gated KJ1-26+CD4+ cells was measured by flow cytometric analysis. Splenocytes were restimulated with OVA peptide and APCs and stained for IFN-γ on days 4, 10, and 30 after transfer. All plots are gated on KJ1-26+CD4+ cells. Representative plots are shown from three experiments with two mice per group.
Figure 5.
Figure 5.
Delayed pathology in the absence of IL-2. 106 purified CD4+ DO11 Rag−/− cells (DOWT) were transferred into sOVA Tg Rag−/− recipients or DO11 Rag−/− IL-2−/− (DOIL-2−/−) cells were transferred into sOVA Tg Rag−/− IL-2−/− mice. (A) Survival is plotted over time as the percentage of surviving mice from five experiments with a total of 19–37 mice/group. Body weight is plotted over time as the percentage of the starting weight before T cell transfer. Data are pooled from three individual experiments with 8–13 mice/group. *, P ≤ 0.05 by t test. (B and C) Paraffin sections of ear skin of sOVA Tg Rag−/− and sOVA Tg Rag−/− IL-2−/− mice 10 (B) and 30 (C) d after T cell transfer were stained with H&E. Frozen sections were stained with anti-CD4 or KJ1-26. One representative section from each group is shown. Clinical scores calculated as described in Materials and methods based on eight parameters (ear swelling, eye swelling, foot swelling, hunching, movement, ruffled fur, alopecia, and scaling) are shown from sOVA Tg Rag−/− and sOVA Rag−/−IL-2−/− mice at days 10 and 30. Values in B and C represent means ± SD.
Figure 6.
Figure 6.
T cell expansion is not controlled in the absence of IL-2. 106 DO11 Rag−/− cells (DOWT) were transferred into sOVA Tg Rag−/− recipients, or DO11 Rag−/− IL-2−/− (DOIL-2−/−) cells were transferred into sOVA Tg Rag−/− IL-2−/− mice. (A) Peripheral lymph node cells harvested on days 10 and 30 were gated on KJ1-26+CD4+, and the total number of DO11 cells was determined by counting and flow cytometry and normalized to the number of DO11 cells recovered from sOVA Tg Rag−/− recipients on day 10 in each experiment. Data are pooled from two experiments. (B) The cells were restimulated with OVA peptide and APCs and stained for intracellular cytokines. Each bar represents the mean percentage of cytokine-positive cells in three to six mice per group. Values in A and B represent means ± SD. (C) Peripheral lymph node cells harvested on day 30 were stained with KJ1-26, anti-CD4, anti-CD25, and Annexin V and analyzed by flow cytometry. Plots are gated on KJ1-26+CD4+CD25neg/low or CD25high cells from one representative mouse per group. Naive DO11 Rag−/− WT and DO11 Rag−/− IL-2−/− cells were included as controls.
Figure 7.
Figure 7.
IL-2 is crucial for peripheral generation of CD25+ cells. 106 purified CD4+ DO11 Rag−/− cells (DOWT) or DO11 Rag−/− IL-2−/− (DOIL-2−/−) cells were transferred either into sOVA Tg Rag−/− recipients or into sOVA Tg Rag−/− IL-2−/− mice. (A) Peripheral lymph node cells were harvested on day 30. CD25 expression on gated KJ1-26+CD4+ cells was analyzed by flow cytometry. Numbers refer to the percentages of CD25high cells. (B) Lymph node cells of sOVA Tg Rag−/− recipients transferred with DO11 Rag−/− cells or sOVA Tg Rag−/− IL-2−/− mice transferred with DO11 Rag−/− IL-2−/− cells were sorted for KJ1-26+CD4+ cells on day 30 after transfer and analyzed for FoxP3 mRNA by real-time fluorogenic RT-PCR. Thymic-generated KJ1-26+CD4+CD25+ cells from DO11 × RIP-mOVA mice were included as a positive control. Data are pooled from two experiments. Values represent means ± SD.

Similar articles

Cited by

References

    1. Tanchot, C., D.L. Barber, L. Chiodetti, and R.H. Schwartz. 2001. Adaptive tolerance of CD4+ T cells in vivo: multiple thresholds in response to a constant level of antigen presentation. J. Immunol. 167:2030–2039. - PubMed
    1. Jameson, S.C. 2002. Maintaining the norm: T-cell homeostasis. Nat. Rev. Immunol. 2:547–556. - PubMed
    1. Walker, L.S., and A.K. Abbas. 2002. The enemy within: keeping self-reactive T cells at bay in the periphery. Nat. Rev. Immunol. 2:11–19. - PubMed
    1. Grossman, Z., B. Min, M. Meier-Schellersheim, and W.E. Paul. 2004. Concomitant regulation of T-cell activation and homeostasis. Nat. Rev. Immunol. 4:387–395. - PubMed
    1. Goldrath, A.W. 2002. Maintaining the status quo: T-cell homeostasis. Microbes Infect. 4:539–545. - PubMed

Publication types

MeSH terms