. 2005 Nov 21;202(10):1349-61.
doi: 10.1084/jem.20051357. Epub 2005 Nov 14.

Avidity for antigen shapes clonal dominance in CD8+ T cell populations specific for persistent DNA viruses

Affiliations

Avidity for antigen shapes clonal dominance in CD8+ T cell populations specific for persistent DNA viruses

David A Price et al. J Exp Med. .

Abstract

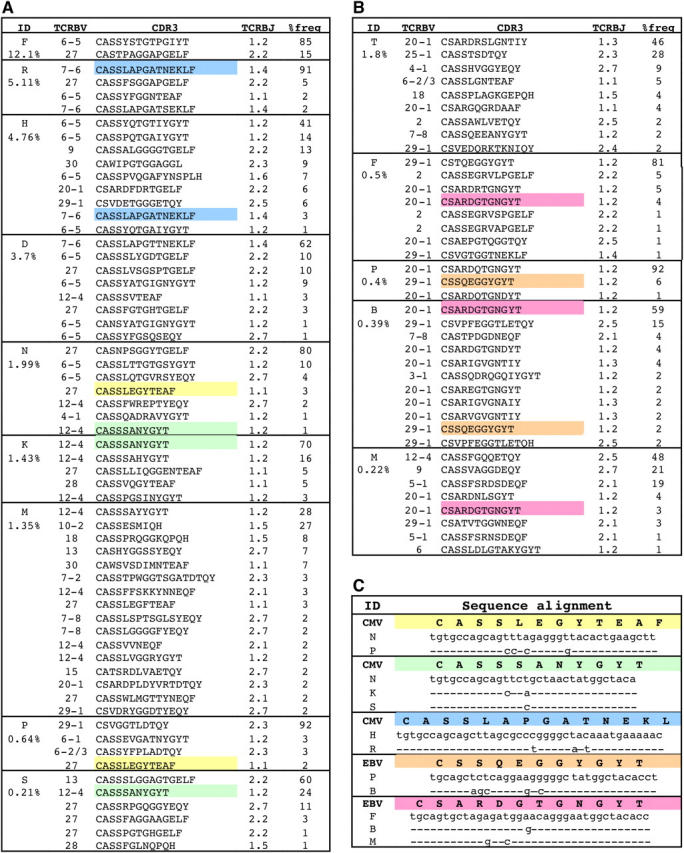
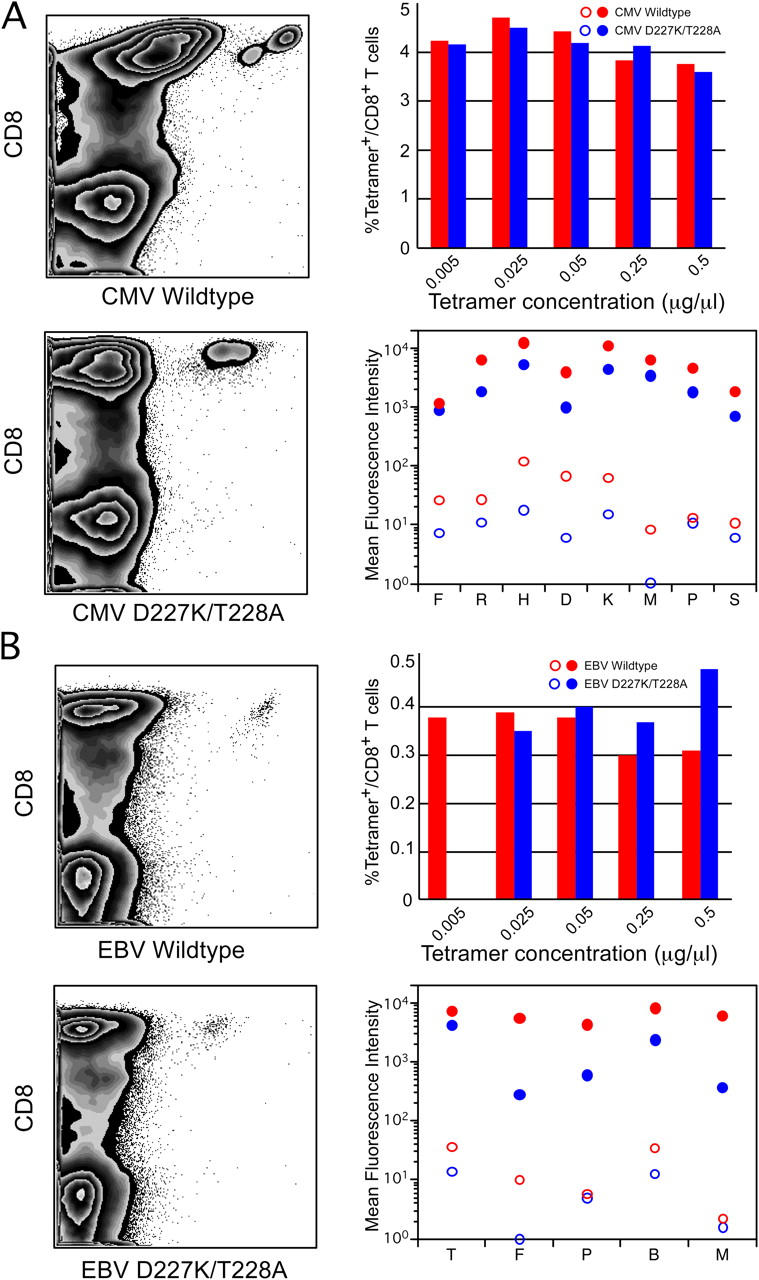
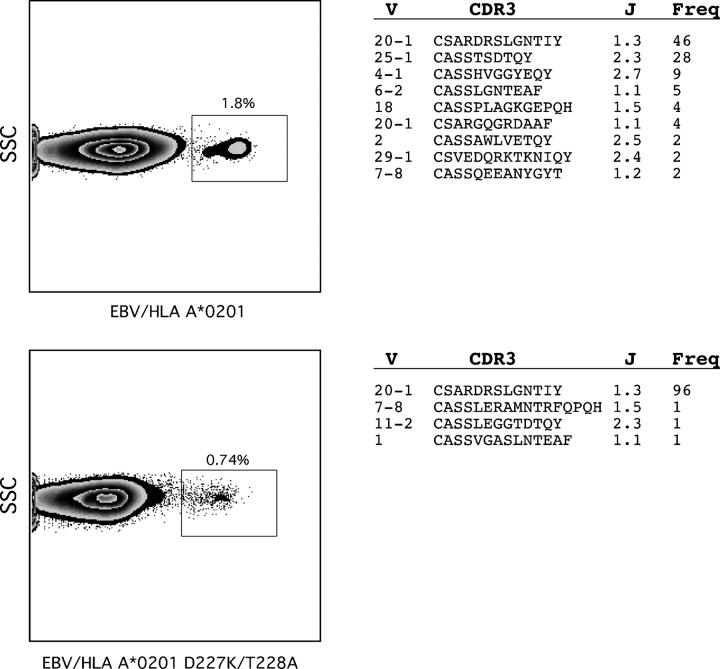
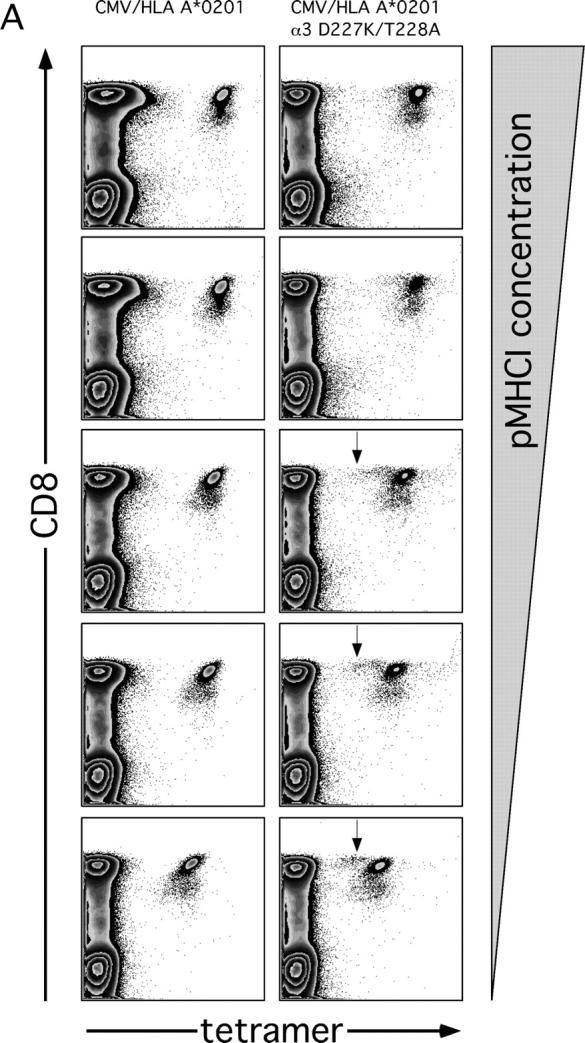
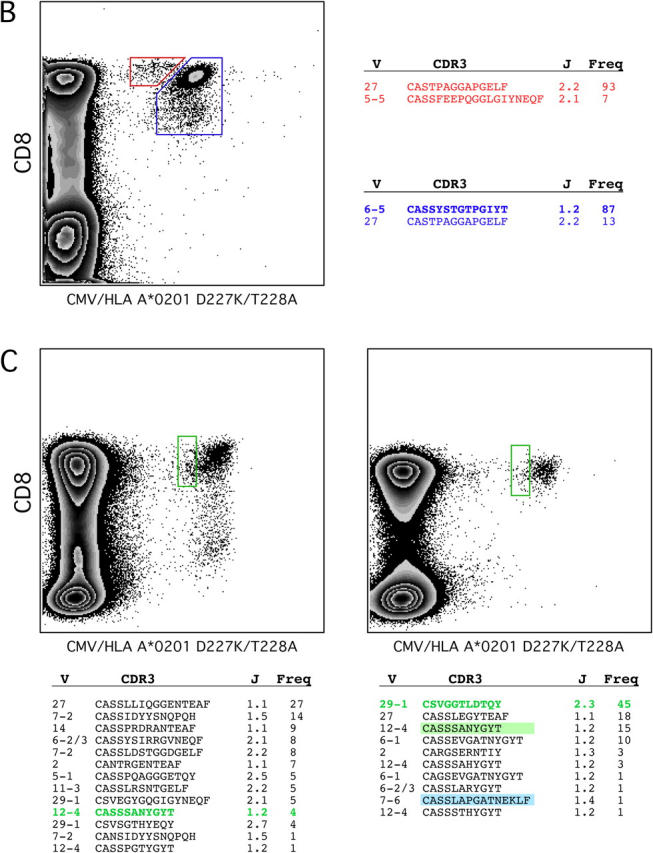
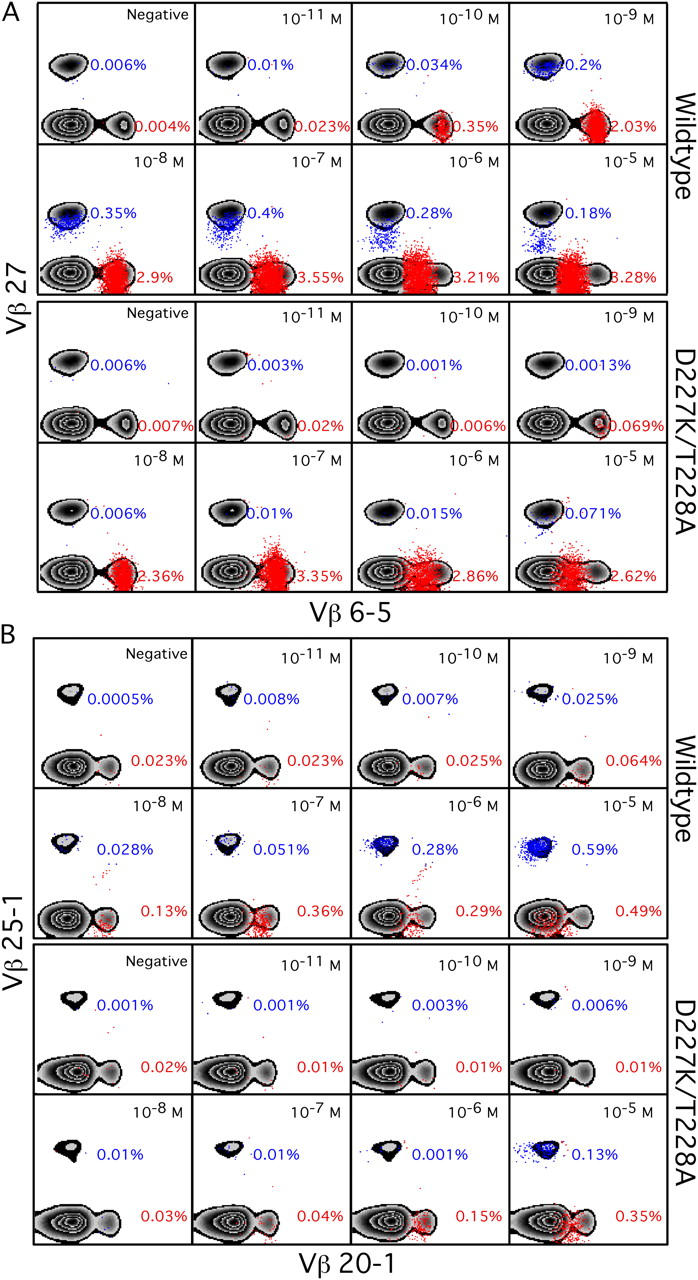
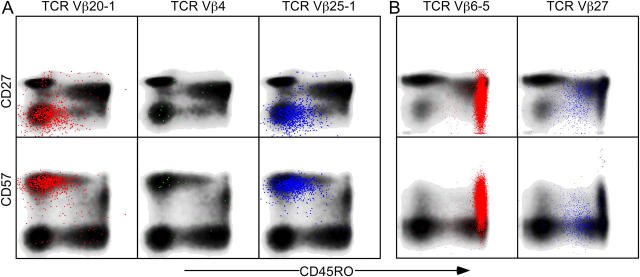
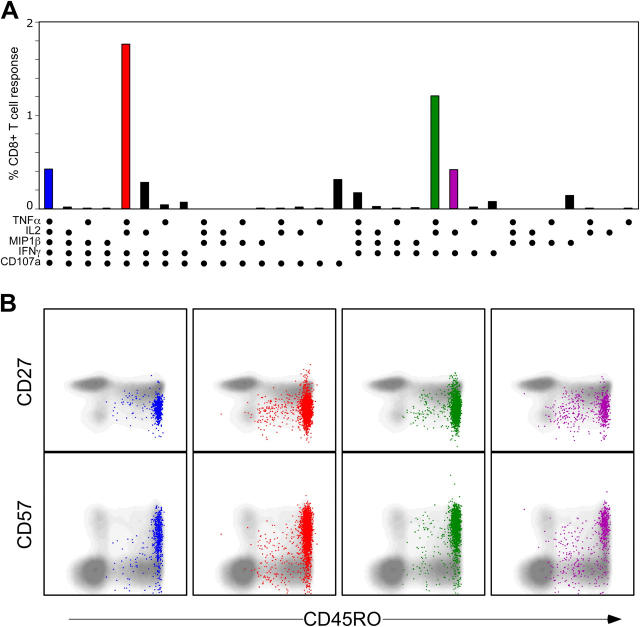
The forces that govern clonal selection during the genesis and maintenance of specific T cell responses are complex, but amenable to decryption by interrogation of constituent clonotypes within the antigen-experienced T cell pools. Here, we used point-mutated peptide-major histocompatibility complex class I (pMHCI) antigens, unbiased TCRB gene usage analysis, and polychromatic flow cytometry to probe directly ex vivo the clonal architecture of antigen-specific CD8(+) T cell populations under conditions of persistent exposure to structurally stable virus-derived epitopes. During chronic infection with cytomegalovirus and Epstein-Barr virus, CD8(+) T cell responses to immunodominant viral antigens were oligoclonal, highly skewed, and exhibited diverse clonotypic configurations; TCRB CDR3 sequence analysis indicated positive selection at the protein level. Dominant clonotypes demonstrated high intrinsic antigen avidity, defined strictly as a physical parameter, and were preferentially driven toward terminal differentiation in phenotypically heterogeneous populations. In contrast, subdominant clonotypes were characterized by lower intrinsic avidities and proportionately greater dependency on the pMHCI-CD8 interaction for antigen uptake and functional sensitivity. These findings provide evidence that interclonal competition for antigen operates in human T cell populations, while preferential CD8 coreceptor compensation mitigates this process to maintain clonotypic diversity. Vaccine strategies that reconstruct these biological processes could generate T cell populations that mediate optimal delivery of antiviral effector function.


Figures

Figure 1.
Figure 1.
Clonal analysis of CD8+ T cells specific for CMV NV9 and EBV GL9. (A) CD8+ T cells specific for CMV NV9. TCRBV usage, CDR3 amino acid sequence and percent frequency, and TCRBJ usage are shown for each clonotype defined by its CDR3. Sequences with identical amino acid residues are shown in color. The percent frequency of CD8+ T cells that bound cognate pMHCI wild-type tetramer is shown below the identifier letter code (ID) for each donor. (B) CD8+ T cells specific for EBV GL9. Details as for A. (C) CDR3 codon usage of CMV- and EBV-specific CD8+ T cell clonotypes that have the same CDR3 amino acid sequence between different donors. Each section defines a CDR3 amino acid sequence and, below that, the CDR3 nucleotide alignments of all constituent clonotypes. Colors correspond to those in A and B.
Figure 2.
Figure 2.
Wild-type and CD8-null pMHCI tetramers stain comparable populations of HLA A*0201-restricted CMV- and EBV-specific CD8+ T cells directly ex vivo. Representative tetramer staining patterns and titrations are shown for: (A) donor D (specificity: CMV NV9) and (B) donor B (specificity: EBV GL9). Data plots represent live, CD3+ lymphocytes. (A and B, bottom right) The mean fluorescence intensity (MFI) of staining with both the wild-type (red) and CD8-null (blue) tetramers at a concentration of 0.5 μg/μl for both cognate (CD8+tet+; closed circles) and noncognate (CD8+tet; open circles) binding is shown for all donors tested. In each case, the MFI values are internally comparable. The p-values derived from nonparametric paired t test comparisons of the MFIs for wild-type and CD8-null tetramer binding across all donors shown were as follows: CMV NV9 cognate, 0.078; CMV NV9 noncognate, 0.078; EBV GL9 cognate, 0.0009; and EBV GL9 noncognate, 0.0625.
Figure 3.
Figure 3.
Interclonal avidity differences can be separated directly ex vivo using wild-type and CD8-null pMHCI tetramers in parallel. CD8+ T cells specific for EBV GL9 in PBMCs from donor T were stained with the corresponding wild-type (top) or CD8-null (bottom) pMHCI tetramers and sorted by flow cytometry. Constituent clonotypes within each sorted population are shown (right; total number of clones analyzed: wild-type, 65; CD8-null, 77). Common clonotypes were identical at the nucleotide level.
Figure 4.
Figure 4.
Differential patterns of staining with CD8-null pMHCI tetramers can distinguish subtle variations in clonotype avidity directly ex vivo. (A) Titration experiments with PBMCs from donor F reveal a distinct subpopulation of CD8+ T cells specific for CMV NV9 (indicated by arrow) that is out-competed for uptake of cognate CD8-null pMHCI tetramer at low concentrations (right); this staining pattern is not observed with the corresponding wild-type pMHCI tetramer (left). Concentrations of each pMHCI tetramer, from top to bottom, are: 0.5, 0.25, 0.05, 0.025, and 0.005 μg/μl. Plots are gated on live lymphocytes. (B) The subdominant clonotype specific for CMV NV9 from donor F is identified by reduced intensity staining with the corresponding CD8-null pMHCI tetramer at low concentrations. Subpopulations of cognate CD8+ T cells were sorted by flow cytometry through gates depicted by the colored boxes (left). Constituent clonotypes within each sorted population are shown (right; total number of clones analyzed: CD8-null bright, 83; CD8-null dim, 87). The dominant clonotype identified with the corresponding wild-type tetramer (Fig. 1) is shown in bold. Common clonotypes were identical at the nucleotide level. (C) Donor K (left) and donor P (right) PBMCs were stained with the CD8-null CMV NV9 pMHCI tetramer and sorted through the gates indicated by the colored boxes. Clonotypes identified by molecular analysis of these sorted cells are shown below each panel (total number of clones analyzed: donor K, 74; donor P, 67). Clonal representation and dominance hierarchies from parallel sorts of CD8+ T cells that stained brightly with the CD8-null reagent reflected those identified with the corresponding wild-type tetramer in each case (Fig. 1 and not depicted); the dominant clonotypes from these sorts are in bold. In donor P, public clonotypes were detected within the gated CD8+ T cell population; these are shown in colored boxes that match those in Fig. 1 C.
Figure 4.
Figure 4.
Differential patterns of staining with CD8-null pMHCI tetramers can distinguish subtle variations in clonotype avidity directly ex vivo. (A) Titration experiments with PBMCs from donor F reveal a distinct subpopulation of CD8+ T cells specific for CMV NV9 (indicated by arrow) that is out-competed for uptake of cognate CD8-null pMHCI tetramer at low concentrations (right); this staining pattern is not observed with the corresponding wild-type pMHCI tetramer (left). Concentrations of each pMHCI tetramer, from top to bottom, are: 0.5, 0.25, 0.05, 0.025, and 0.005 μg/μl. Plots are gated on live lymphocytes. (B) The subdominant clonotype specific for CMV NV9 from donor F is identified by reduced intensity staining with the corresponding CD8-null pMHCI tetramer at low concentrations. Subpopulations of cognate CD8+ T cells were sorted by flow cytometry through gates depicted by the colored boxes (left). Constituent clonotypes within each sorted population are shown (right; total number of clones analyzed: CD8-null bright, 83; CD8-null dim, 87). The dominant clonotype identified with the corresponding wild-type tetramer (Fig. 1) is shown in bold. Common clonotypes were identical at the nucleotide level. (C) Donor K (left) and donor P (right) PBMCs were stained with the CD8-null CMV NV9 pMHCI tetramer and sorted through the gates indicated by the colored boxes. Clonotypes identified by molecular analysis of these sorted cells are shown below each panel (total number of clones analyzed: donor K, 74; donor P, 67). Clonal representation and dominance hierarchies from parallel sorts of CD8+ T cells that stained brightly with the CD8-null reagent reflected those identified with the corresponding wild-type tetramer in each case (Fig. 1 and not depicted); the dominant clonotypes from these sorts are in bold. In donor P, public clonotypes were detected within the gated CD8+ T cell population; these are shown in colored boxes that match those in Fig. 1 C.
Figure 5.
Figure 5.
Functional titration experiments in the absence of pMHC-CD8 binding expose a proportionately greater coreceptor contribution to antigen sensitivity in low avidity clonotypes directly ex vivo. C1R cells expressing equivalent levels of either wild-type or CD8-null HLA A*0201 on the cell surface were pulsed with the indicated concentrations of either CMV NV9 (A) or EBV GL9 (B) peptide for 2 h and washed thoroughly. PBMCs from donor F (A) or donor T (B) were pulsed with the unrelated HLA A*0201-restricted peptide SLYNTVATL to block autologous presentation of NV9 or GL9 peptides, respectively. For each condition, 2 × 10⁶ PBMCs were added to 106 C1R cells and incubated for 6 h in the presence of brefeldin A; cells were then analyzed for intracellular IFNγ production by flow cytometry (representative plots are shown in Fig. S1, available at http://www.jem.org/cgi/content/full/jem.20051357/DC1). Plots are gated on CD3+, CD8+ lymphocytes. Colored dots represent T cells expressing the indicated subdominant (blue) or dominant (red) TCRVβ that produce IFNγ; these events are superimposed on density plots representing the total CD8+ T cell population according to expression of subdominant (y axis) or dominant (x axis) TCRVβ. The percentage of all CD8+ T cells that express subdominant (blue) or dominant (red) TCRVβ and produce IFNγ is indicated. Precise quantification of the dominant clonotype, but not the subdominant clonotype, in B was hampered by TCR down-regulation. Peptide concentrations are shown at top right in each plot. Negative controls were mock-pulsed with medium. Other effector functions showed similar patterns (not depicted).
Figure 6.
Figure 6.
CD8+ T cell clonotypes specific for the same viral antigen can have similar or different memory phenotypes. PBMCs were stained with the cognate wild-type pMHCI tetramer and mAbs specific for CD8, CD27, CD45RO, CD57, and the indicated TCRVβ. The memory phenotype of the total CD8+ population is depicted as a black density plot, and the antigen-specific cells separated according to TCRVβ expression are shown superimposed as colored dots. (A) Distinct CD8+ T cell clonotypes specific for EBV GL9 in donor T exhibit similar memory phenotypes despite differences in avidity. (B) Distinct CD8+ T cell clonotypes specific for CMV NV9 in donor F exhibit different memory phenotypes.
Figure 7.
Figure 7.
Individual CD8+ T cell clonotypes specific for the same antigen can display similar functionality despite differences in phenotype and avidity. (A) PBMCs from donor F were stimulated for 5 h with CMV NV9 peptide and stained with a panel of mAbs to examine degranulation (CD107a), cytokine production (IFNγ, TNFα, IL2), and chemokine production (MIP1β). The 31 possible positive responses that can be discerned from simultaneous examination of these five functional parameters are shown on the x axis. The total frequency of CD8+ T cells displaying each particular functional profile is shown on the y axis. The four major responses are colored in blue, red, green, and purple. (B) The memory phenotypes of specific T cells expressing one of the four major functional patterns shown in A are overlaid on the phenotype of the total CD8+ T cell population. Two memory populations are apparent for each functional response, corresponding directly to the phenotypes of the two major CD8+ T cell clonotypes specific for CMV NV9 (Fig. 6). All events shown are CD3+, CD8+, CD4, CD14, CD19, with a small lymphocyte forward/side scatter profile excluding doublets and aggregates.

Similar articles

Cited by

References

    1. van der Merwe, P.A., and S.J. Davis. 2003. Molecular interactions mediating T cell antigen recognition. Annu. Rev. Immunol. 21:659–684. - PubMed
    1. Kedl, R.M., J.W. Kappler, and P. Marrack. 2003. Epitope dominance, competition and T cell affinity maturation. Curr. Opin. Immunol. 15:120–127. - PubMed
    1. Butz, E.A., and M.J. Bevan. 1998. Massive expansion of antigen-specific CD8+ T cells during an acute virus infection. Immunity. 8:167–175. - PMC - PubMed
    1. Smith, A.L., M.E. Wikstrom, and B. Fazekas de St Groth. 2000. Visualizing T cell competition for peptide/MHC complexes: a specific mechanism to minimize the effect of precursor frequency. Immunity. 13:783–794. - PubMed
    1. Kedl, R.M., W.A. Rees, D.A. Hildeman, B. Schaefer, T. Mitchell, J. Kappler, and P. Marrack. 2000. T cells compete for access to antigen-bearing antigen-presenting cells. J. Exp. Med. 192:1105–1113. - PMC - PubMed

MeSH terms

Substances