. 2005 Dec 1;19(23):2849-61.
doi: 10.1101/gad.1364105. Epub 2005 Nov 14.

A Brg1 mutation that uncouples ATPase activity from chromatin remodeling reveals an essential role for SWI/SNF-related complexes in beta-globin expression and erythroid development

Affiliations

A Brg1 mutation that uncouples ATPase activity from chromatin remodeling reveals an essential role for SWI/SNF-related complexes in beta-globin expression and erythroid development

Scott J Bultman et al. Genes Dev. .

Abstract

The Brg1 catalytic subunit of SWI/SNF-related complexes has been implicated in many developmental and physiological processes, but null homozygotes die as blastocysts prior to implantation. To circumvent this early embryonic lethality, we performed an ENU mutagenesis screen and generated a Brg1 hypomorph mutation in the ATPase domain. The mutant Brg1 protein is stable, assembles into SWI/SNF-related complexes, and exhibits normal ATPase activity but is unable to establish DNase I hypersensitivity sites characteristic of open chromatin. Mutant embryos develop normally until midgestation but then exhibit a distinct block in the development of the erythroid lineage, leading to anemia and death. The mutant Brg1 protein is recruited to the beta-globin locus, but chromatin remodeling and transcription are perturbed. Histone acetylation and DNA methylation are also affected. To our knowledge, Brg1 is the first chromatin-modifying factor shown to be required for beta-globin regulation and erythropoiesis in vivo. Not only does this mutation establish a role for Brg1 during organogenesis, it also demonstrates that ATPase activity can be uncoupled from chromatin remodeling.


Figures

Figure 1.
Figure 1.
Brg1 ENU mutagenesis screen. The mutagenesis and breeding strategy that was implemented is outlined by showing a schematic of mouse chromosome 9 with the position of curly whiskers (cw), Brg1, and D9Mit59 loci. Genetic distances are indicated in centimorgans (cM) in the top right panel. cw/cw males (top right) were mutagenized (ENU) and bred to wild-type females (top left). (Middle right) G1 progeny inherited one wild-type chromosome 9 from the dam and one mutagenized cw chromosome 9 from the sire. (Middle left) G1 specimens were mated to a tester stock to determine which, if any, carried a Brg1 mutation (Brg1ENU). (Bottom) In the absence of a Brg1ENU mutation, G2 progeny fell into four equally represented genotypic classes. (Bottom right) However, inheritance of a Brg1ENU mutation that failed to complement Brg1null would result in underrepresentation or loss of the curly whisker class (enclosed by a thick box). (Bottom, second from left) In this case, the Brg1ENU mutation could be recovered in carriers (enclosed by a thin box).
Figure 2.
Figure 2.
Molecular nature of the Brg1ENU1 mutation. (A) DNA sequences of wild-type (WT) and Brg1ENU1 (Mut) RT-PCR products are displayed showing an A- to-G point mutation, resulting in a glutamic acid (Glu, E)-to-glycine (Gly, G) amino acid substitution. (B, top) A schematic of the Brg1 protein, indicating the position of the E1083G amino acid substitution between putative helicase motifs IV and V of the catalytic ATPase domain. (ZFP) Zinc-finger protein interaction domain; (Rb) retinoblastoma protein interaction domain. (Bottom) Amino acid sequence alignment showing Homo sapiens and Mus musculus Brg1 E1083 and adjacent residues compared with H. sapien/M. musculus Brm, D. melanogaster BRM, and S. cerevisiae SWI2 and STH1 within the SWI2/SNF2 subfamily, as well as H. sapien/M. musculus Snf2l and Etl1 and S. cerevisiae RAD54 outside the SWI2/SNF2 subfamily. E1083 and corresponding residues are highlighted with a yellow vertical bar. Identities are represented by dots.
Figure 3.
Figure 3.
Normal stability and ATPase activity of mutant SWI/SNF-related complexes. (A) Brg1 mRNA and protein expression. (Top) Northern blot of wild-type (WT) and mutant (Mut) E12.5 embryo RNAs hybridized with Brg1 and Actin control probes. (Bottom) Western blot of E12.5 embryo protein lysates probed with BRG1 and Actin control antibodies. (B) Coimmunoprecipitation of BAFs from wild-type (WT) and mutant (Mut) E12.5 embryo protein lysates. Shown are Western blot panels containing input protein (under Input heading), proteins coimmunoprecipitated with a BRG1 antibody (under αBrg1 IP heading), and a mock coimmunoprecipitation where BRG1 antibody was omitted but Protein A/G-conjugated agarose beads were added to wild-type protein lysates and processed (Mock). Western blot panels were probed with antibodies specific for BAF250, BRG1, BAF155, BAF57, and BAF47. IgG heavy-chain bands (∼55 kDa) are visible in IP lanes of the BAF57 panel. (C) ATPase assay. Wild-type (WT) and mutant (Mut) SWI/SNF-related complexes, isolated from E12.5 embryos by coimmunoprecipitation using a BRG1-specific antibody, were incubated with radiolabeled ATP, and reactions were subjected to thin-layer chromatography. Hydrolyzed [γ32P]Pi and unhydrolyzed [γ32P]ATP and are indicated on the right. Two negative controls are shown: (Mock) Mock immunoprecipitation as described above; (Neg) no protein added to radiolabeled ATP reaction mixture. (D) Quantification of ATPase assays. Densitometry was used to measure [γ32P]Pi and [γ32P]ATP values. The ratio of [γ32P]Pi to [γ32P]ATP was calculated and the negative control background signal was subtracted. Wild-type samples were normalized to 100%. The experiment was repeated three times, and error bars are shown.
Figure 4.
Figure 4.
Brg1null/ENU1 erythroid phenotype. (A,B) Bright-field photographs of wild-type control (left) and mutant (right) E12.5 embryos inside of yolk sacs (A) and with yolk sacs removed (B). (C) Schematic of erythroid lineage. (HSC) Hematopoietic stem cell; (BFU-E) erythroid burst-forming unit; (CFU-E) erythroid colony-forming unit; (E) proerythroblast; (B) basophilic erythroblast; (P) polychromatic erythroblast; (O) orthochromatic erythroblast; (N) enucleated reticulocyte. Expression status of Kit and Ter119 cell-surface markers utilized for flow cytometric anlayses in panel F are indicated below. (D) Cystospin preparations of wild-type (top) and mutant (bottom) fetal liver cells stained with Wright-Giemsa. Abbreviations are the same as for panel C except for two additions: (Y) yolk sac derived erythrocyte; (M) megakaryocyte. Megakaryocytes were present in wild-type fetal livers but none are shown in the upper panel. (E) Flow cytometry of wild-type (top) and mutant (bottom) fetal liver cells showing forward scatter versus side scatter. Arrows point to smaller, more mature population of erythroid cells that were well represented in wild type but underrepresented in mutants. (F) Distribution of Kit and Ter119 wild-type (top) and mutant (bottom) E12.5 fetal liver cells. (Upper left quadrants) Kit-positive cells. (Upper right quadrants) Kit/Ter119 double-positive cells. (Lower right quadrants) Ter119-positive cells. (Lower left quadrants) Double-negative cells. Percentage of cells in each quadrant is indicated.
Figure 5.
Figure 5.
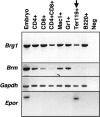
Brg1 and Brm expression in erythroid cells and other hematopoietic lineages. Shown are negative images of ethidium bromide-stained agarose gels of Brg1 and Brm RT-PCR products amplified from the following flow-sorted cell populations: (CD4+) T helper lymphocytes; (CD8+) cytotoxic T lymphocytes; (CD4+ CD8+) immature double-positive T lymphocytes; (Mac1+) macrophages; (Gr1+) granulocytes; (Ter119+) erythroid (highlighted with a vertical arrowhead); (B220+) B lymphocytes. Two controls were also performed: (Embryo) E12.5 positive control; (Neg) no template negative control. In addition to Brg1 and Brm, two control amplicons were included: (Gapdh) glyceraldehyde 3-phosphate dehydrogenase; (Epor) erythropoietin receptor, to control for specificity of Ter119 erythroid marker.
Figure 6.
Figure 6.
Expression of β-globin genes. (A) Shown are images of ethidium bromide-stained agarose gels containing Actin and β-globin RT-PCR products amplified from wild-type (WT) or mutant (Mut) E12.5 fetal livers. For each panel, the upper band is Actin and the lower band is a β-globin (the positions of which are indicated with arrowheads). The individual β globin amplicons are, from left to right, βmaj, βmin, εY, and βH1. For the εY and βH1 panels, two templates were used: (1) Fetal livers; (2) Kit-positive cells from fetal livers that were isolated by flow sorting. Expression of both embryonic globins can be observed in wild-type and mutant fetal livers because of yolk sac-derived primitive erythocytes still in the general circulation (see 1s). In contrast, neither embryonic globin is ectopically expressed in mutant Kit-positive definitive erythroblasts (see 2s). (MW) One-kilobase molecular weight standard. (B) Quantification of β-globin expression levels. For wild-type samples (black bars), ratios of β globin to actin were normalized to 100%. Mutant samples (gray bars) were expressed as a percentage relative to wild type. εY and βH1 values are based on fetal liver data (1s from A).
Figure 7.
Figure 7.
Chromatin structure is altered at the β-globin locus. (A) Schematic of mouse β-globin locus. The LCR consists of six HSs (vertical arrows), although HS5 is a weak site in the mouse (denoted by thin vertical arrow). EKLF and GATA-1 bind to HS2 and HS3. All four β-globin genes consist of three exons (black boxes) that are transcribed in the same orientation and arranged in the order of their developmental expression. (B) Recruitment of Brg1 to the β-globin LCR. ChIP assays demonstrating that wild-type and mutant Brg1 are recruited to HS2 and HS3. Shown are images of ethidium bromide-stained agarose gels of HS2, HS3, and a negative control (Necdin promoter) amplified from wild-type (WT) or mutant (Mut) E12.5 fetal liver cells. (MW) One-kilobase molecular weight standard (the 1- and 0.5-kb bands are visible); (Pos) wild-type genomic DNA served as a positive control for PCR; (Neg) no template negative control; (Input) total chromatin, sheared but not immunoprecipitated; (ChIP) chromatin immunoprecipitated with a BRG1 antibody; (M) mock immunoprecipitation, which served as a negative control, where BRG1 antibody was omitted from wild-type chromatin but processed in a manner identical to ChIP samples. (C) DNase I hypersensitivity assays of β-globin LCR. Nuclei from wild-type (WT) and mutant (Mut) E12.5 fetal liver cells were digested with increasing amounts of DNase I (from left to right: 0.01, 0.10, 0.50, 1.00, and 2.50 U of enzyme per microgram of DNA). Genomic DNA was subsequently prepared, and HSs 1, 2, 3, 4, and 6 were PCR amplified. To correct for small differences in the amount of DNA that might have been recovered for each sample, an Mit marker (D9Mit59) was amplified as a control (see CNTRL panel). (Pos) Wild-type genomic DNA served as a positive control for each amplicon; (Neg), no template was used as a negative control for each amplicon. Each panel is an image of PCR products run on an ethidium bromide-stained agarose gel. (MW) One-kilobase Plus molecular weight standard (bands from 1 kb to 100 bp are visible).
Figure 8.
Figure 8.
Aberrant epigenetic modifications at the β-globin locus. (A) ChIP assays showing histone 3 (H3) acetylation status at the β-globin LCR. Shown at the left are images of ethidium bromide-stained agarose gels containing HSs 1, 2, 3, 4, and 6 amplified from wild-type (WT) or mutant (Mut) E12.5 tissues. Necdin promoter was also amplified as a control because it corresponds to the promoter of a gene (Necdin) that is acetylated and expressed in neurons and other cell types. (Pos) Wild-type genomic DNA served as a positive control for PCR; (Neg) negative control, mock immunoprecipitation where no antibody was added to wild-type FL chromatin but processed in a manner identical to ChIP samples; (Input) total chromatin, sheared but not immunoprecipitated, prepared from fetal liver (FL) or head (H) cells; (ChIP) FL or H chromatin immunoprecipitated with an anti-acetyl H3 antibody. Shown at the right is quantification of the ChIP data utilizing digitized images of the gels. ChIP band intensities were divided by Input band intensities after subtracting out background levels. Values were normalized to 100% for wild-type samples (black bars). Mutant samples (gray bars) were expressed as a percentage of wild-type values. (B) Genome-wide DNA methylation analysis. Image of an ethidium bromide-stained agarose gel of wild-type (WT) and mutant (Mut) genomic DNAs digested with Hpa II (H) or Msp I (M). (MW) One-kilobase ladder molecular weight standard. (B) Sodium bisulfite mutagenesis analysis of HS1 and HS2 within β-globin LCR of wild-type and mutant fetal liver cells. (Unfilled circles) Unmethylated CpGs; (filled circles) methylated CpGs.

Similar articles

Cited by

References

    1. Armstrong, J.A., Bieker, J.J., and Emerson, B.M. 1998. A SWI/SNF-related chromatin remodeling complex, E-RC1, is required for tissue-specific transcriptional regulation by EKLF in vitro. Cell 95: 93-104. - PubMed
    1. Ausubel, F.M., Brent, R., Kingston, R.E., Moore, D.D., Seidman, J.G., Smith, J.A., and Struhl, K. 1992. Current protocols in molecular biology. Greene Publishing Associates/Wiley Interscience, New York.
    1. Banine, F., Bartlett, C., Gunawardena, R., Muchardt, C., Yaniv, M., Knudsen, E.S., Weissman, B.E., and Sherman, L.S. 2005. SWI/SNF chromatin-remodeling factors induce changes in DNA methylation to promote transcriptional activation. Cancer Res. 65: 3542-3547. - PubMed
    1. Bender, M.A., Reik, A., Close, J., Telling, A., Epner, E., Fiering, S., Hardison, R., and Groudine, M. 1998. Description and targeted deletion of 5′ hypersensitive site 5 and 6 of the mouse β-globin locus control region. Blood 92: 4394-4403. - PubMed
    1. Bultman, S., Gebuhr, T., Yee, D., La Mantia, C., Nicholson, J., Gilliam, A., Randazzo, F., Metzger, D., Chambon, P., Crabtree, G., et al. 2000. A Brg1 null mutation in the mouse reveals functional differences among mammalian SWI/SNF complexes. Mol. Cell 6: 1287-1295. - PubMed

Publication types

MeSH terms