. 2005 Dec 1;19(23):2877-87.
doi: 10.1101/gad.357705. Epub 2005 Nov 14.

FGF-dependent Notch signaling maintains the spinal cord stem zone

Affiliations

FGF-dependent Notch signaling maintains the spinal cord stem zone

Jun Akai et al. Genes Dev. .

Abstract

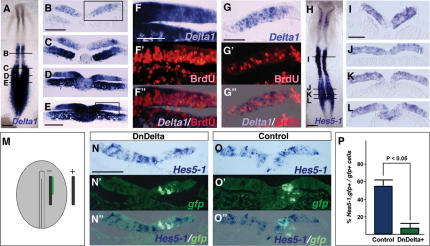
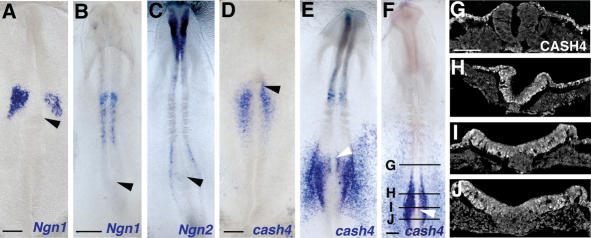
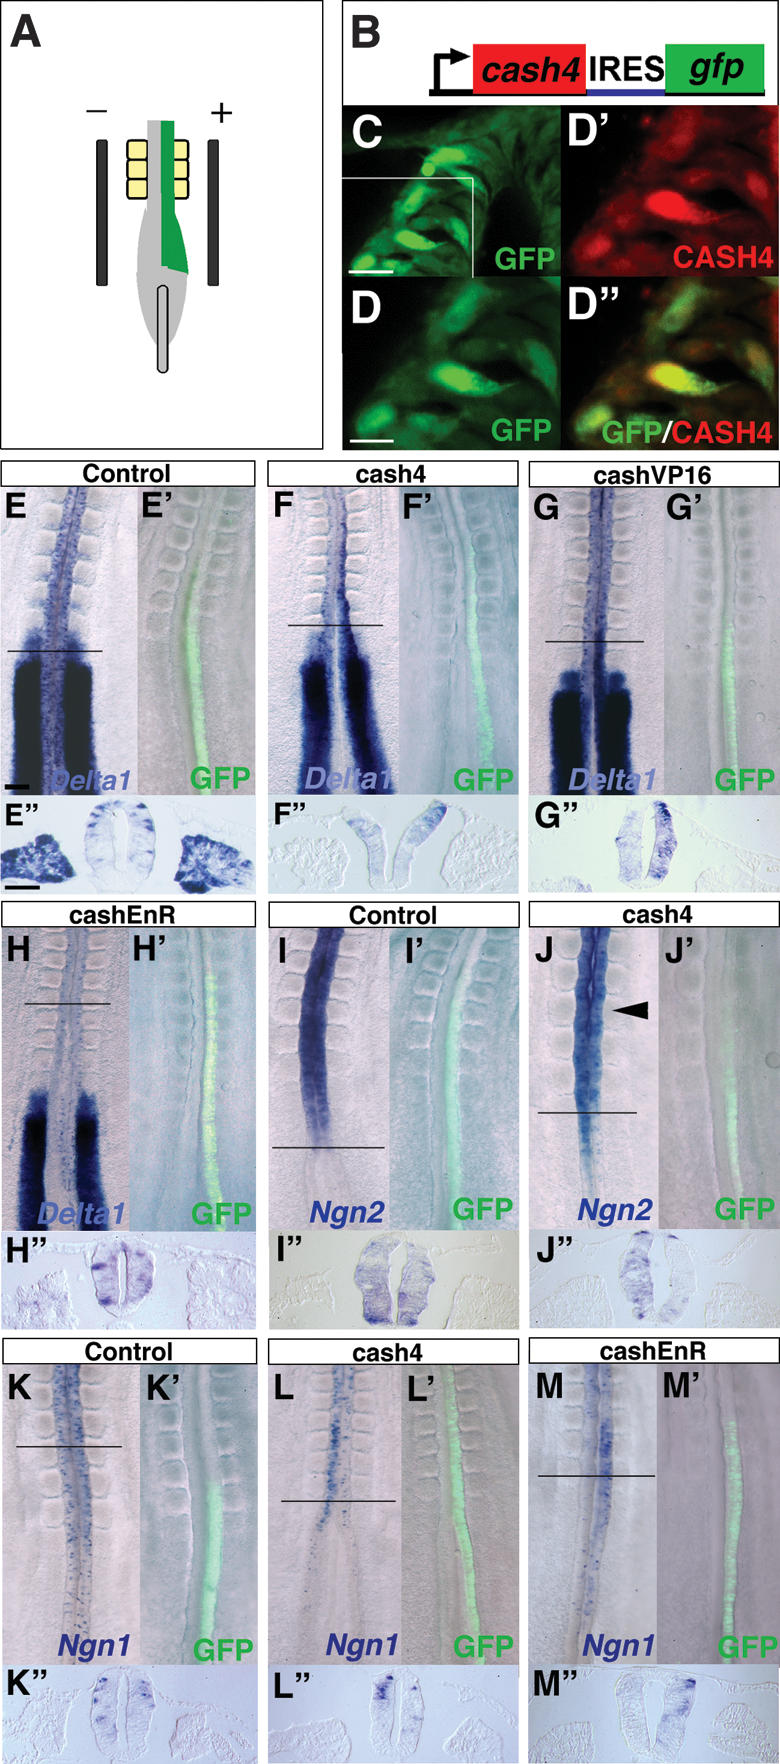
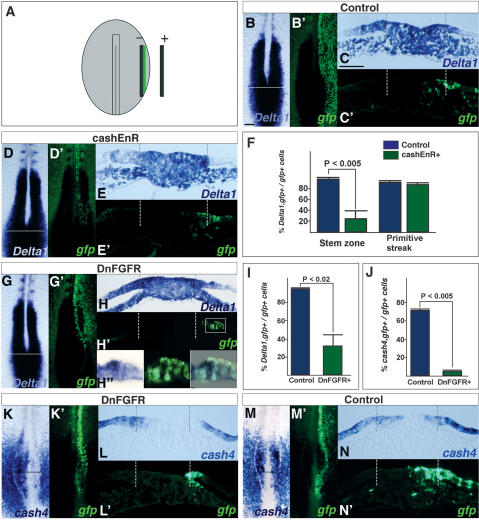
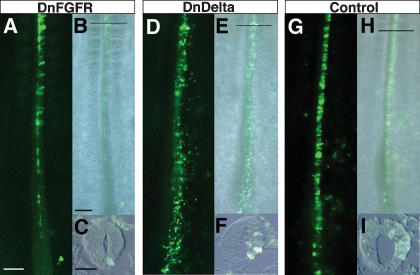
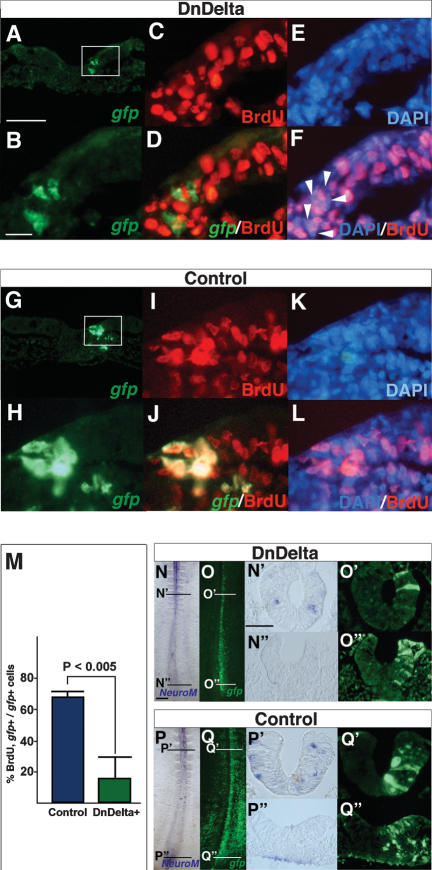
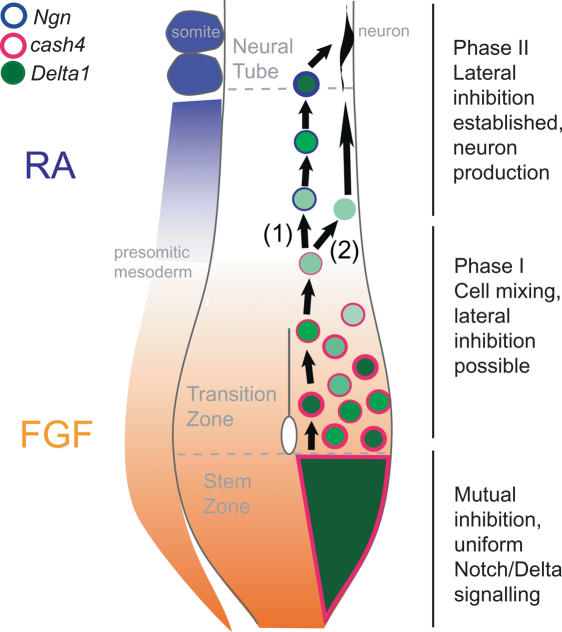
Generation of the spinal cord relies on proliferation of undifferentiated cells located in a caudal stem zone. Although fibroblast growth factor (FGF) signaling is required to maintain this cell group, we do not know how it controls cell behavior in this context. Here we characterize an overlooked expression domain of the Notch ligand, Delta1, in the stem zone and demonstrate that this constitutes a proliferative cell group in which Notch signaling is active. We show that FGF signaling is required for expression of the proneural gene cash4 in the stem zone, which in turn induces Delta1. We further demonstrate that Notch signaling is required for cell proliferation within the stem zone; however, it does not regulate cell movement out of this region, nor is loss of Notch signaling sufficient to drive neuronal differentiation within this tissue. These data identify a novel role for the Notch pathway during vertebrate neurogenesis in which signaling between high Delta1-expressing cells maintains the neural precursor pool that generates the spinal cord. Our findings also suggest a mechanism for the establishment of the cell selection process, lateral inhibition: Mutual inhibition between Delta/Notch-expressing stem zone cells switches to single Delta1-presenting neurons as FGF activity declines in the newly formed neuroepithelium.


Figures

Figure 1.
Figure 1.
Stem zone cells experiencing Notch signaling are mitotically active. (A–E) Delta1 at HH8 stage (A) and in transverse sections (TS) (B–E). (B) Closing neural tube. (C) Transition zone. (D) Hensen's node level. (E) Stem zone. (F) Higher magnification of boxed region in E.(F′) BrdU in the same section. (F″) Merged Delta1/BrdU image. (G) Higher magnification of boxed region in B. (G′) BrdU in the same section. (G″) Merged Delta1/BrdU image. (H–L) Hes5-1 at HH8+ (H) and in TS (I–L). (M) HH4 embryo indicating placement of electrodes and DNA solution (green) for direct targeting of stem zone cells. (N–N″) Stem zone-level TS of a DnDelta–IRES–GFP-expressing embryo. (N) Hes5-1. (N′) gfp-positive cells in the same section. (N″) Merged image. (O–O″) Control IRES–GFP-only-expressing embryo. Hes5-1 (O) and gfp-positive (O′) cells in the same section. (O″) Merged Hes5-1/gfp image. (P) Frequency of Hes5-1 expression in gfp-positive cells obtained in DnDelta and control conditions. In controls, 55.3% (SD 6.6%; 16 sections from three embryos; blue bar) of gfp-positive cells had Hes5-1 gene expression, while only 7.3% (SD 5.5%; 13 sections from three embryos; green bar) of gfp-positive cells expressed Hes5-1 in DnDelta transfected embryos. Bars: A,H, 200 μm; B,E,I,N, 50 μm; F,G, 20 μm.
Figure 2.
Figure 2.
Cash4 and Ngn2 are expressed in complementary domains in the extending neural axis. Ngn1 at HH7 (A) and HH8 (B). (C) Ngn2 at HH8. cash4 at HH5+ (D), HH8 (E), and HH9 (F). CASH4 at HH9 seen in TS (indicated on a different embryo in F), in the last formed somite (G), in the transition zone (H), anterior to the Hensen's node (I), and in the stem zone (J). Bars: A,D, 100 μm; B,F, 200 μm; G, 50 μm. (Arrowheads) Hensen's node.
Figure 3.
Figure 3.
CASH4 works as an activator to induce Delta1. (A) Electroporation at HH10. (B) cash4 expression vector (cash4–IRES–GFP). (C) GFP-positive cells following misexpression of cash4–IRES–GFP in the neural tube. (D–D″) Colocalization of GFP and CASH4 proteins. (D) Higher magnification of the boxed region in C.(D′) CASH4 detected with a CASH4 antibody in the same section. (D″) Merged image shows CASH4 in the nuclei of the GFP-positive cells. (E–M″) Misexpression experiments. In all cases, the first panel shows in situ of gene of interest, the second panel shows GFP localization prior to fixation, and the third panel shows TS through the region of misexpression indicated in the first panel. (E–E″) Delta1 following control vector misexpression. (F–F″) Delta1 following cash4 misexpression. (G–G″) Delta1 following cashVP16–IRES–GFP misexpression. (H–H″) Delta1 following cashEnR–IRES–GFP misexpression. We saw no change in Delta1 expression (apparent asymmetry is due to compression of tissue in whole-mount prep). (I–I″) Ngn2 following control vector misexpression. (J–J″) Ngn2 following cash4–IRES–GFP misexpression. (K–K″) Ngn1 following control vector misexpression. (L–L″) Ngn1 following misexpression of cash4–IRES–GFP. (M–M″) Ngn1 following cashEnR–IRES–GFP misexpression. Bars: C, 20 μm; D, 10 μm; E, 100 μm; E″, 50 μm.
Figure 4.
Figure 4.
FGF-dependent cash4 expression is required for Delta1 expression in the stem zone. (A) HH4 embryo indicating placement of electrodes and DNA solution (green) for targeting prospective stem zone cells in the lateral epiblast. (B,B′) Control IRES–GFP-only transfected embryo. Delta1 (B) and gfp (B′) expression. (C–C″) TS of Delta1. (C′) gfp. Delta1 (D) and gfp (D′) expression following cashEnR misexpression. (E–E′) TS showing the loss of Delta1 expression in the stem zone. (F) The proportion of gfp-positive cells expressing Delta1 in the stem zone and primitive streak. In cashEnR misexpressing embryos, 25.6% of gfp-positive cells express Delta1 (SD 14.8%; 10 slides from three embryos; green bar). This is significantly lower than the proportion observed in the stem zone of control embryos (99% ± 1.4%, 13 sections from three representative embryos; blue bar). In contrast, in the primitive streak the proportion of gfp-positive cells expressing Delta1 in cashEnR embryos (90.4% ± 1.72%) is not significantly different from that in controls (93.3% ± 1.3%). (G,G′) DnFGFR1-gfp misexpressing embryo. (H–H″) TS and high-power views (boxed regions) showing loss of Delta1 expression in DnFGFR1-gfp positive cells in the stem zone. (I) The proportion of gfp-positive Delta1-expressing cells following DnFGFR1 misexpression (32.9% ± 12.1%; nine sections from three embryos; green bar) is significantly lower than in control embryos (13 sections from three embryos; blue bar). (J) cash4 expression in the stem zone following DnFGFR1 misexpression. In control embryos, 72.1% (SD 2.1%; 9 sections from two embryos; blue bar) of gfp-positive cells in the stem zone express cash4, whereas only 5.7% (SD 1.1%; eight sections from two embryos; green bar) of cells in the stem zone have cash4 expression in the DnFGFR1 expression embryo. DnFGFR-misexpressing embryo (K,K′) and TS of cash4 (L–L′) in gfp-expressing cells. (M,M′) Control embryo. (N–N′) TS of cash4 and gfp expression. Dashed lines indicate the border between the primitive streak and the stem zone epiblast. Bars: B, 100 μm; C, 50 μm.
Figure 5.
Figure 5.
Notch signaling is not required to retain cells in the stem zone. Distribution of GFP-positive cells 24 h after misexpression of constructs in the stem zone at HH4 (imaged prior to fixation). (A) DnFGFR1–IRES–GFP-expressing cells. (B) Merged bright-field/GFP image. (C) TS of GFP cells in the neural tube. (D) DnDelta–IRES–GFP-expressing cells. (E) Merged bright-field/GFP image. (F) TS of GFP cells in the neural tube. (G) Control IRES–GFP-expressing cells. (H) Merged bright-field/GFP image. (I) TS. Bars: A,B, 100 μm; C, 50 μm.
Figure 6.
Figure 6.
Notch signaling is required for proliferation of stem zone cells. (A) TS at stem zone level of DnDelta–IRES–GFP-expressing cells showing gfp. (B) Higher magnification of boxed region in A. (C) BrdU-incorporating cells (red). (D) gfp/BrdU merged image. (E) DAPI. (F) DAPI/BrdU merged image; note nuclei of gfp-positive cells (indicated by arrowheads) are BrdU-negative. (G–L) TS at stem zone level in control IRES–GFP embryo. (G) gfp. (H) Higher magnification of boxed field in G. (I) BrdU-incorporating cells (red). (J) Merged gfp/BrdU image. (K) DAPI. (L) DAPI/BrdU merged image. (M) In the stem zone, proportion of gfp-expressing/BrdU-positive cells is 16.8% (SD 14.7%; 13 sections from three embryos; green bar) in DnDelta-expressing embryos. This is significantly lower than in control embryos (68.3% ± 3.0%; seven sections from three embryos; blue bar). (N–Q″) NeuroM expression following misexpression of DnDelta–IRES–GFP at HH4. (N) NeuroM in neural tube. TS of the neural tube (N′) and stem zone (N″). (O) DnDelta–IRES–GFP cells in the same embryo as N, and in TS of the neural tube (O′) and stem zone (O″). NeuroM in control IRES–GFP-expressing embryo (P) and in TS of the neural tube (P′) and stem zone (P″). (Q) gfp-only-expressing cells in the same embryo as P. TS of the neural tube (Q″) and stem zone (Q″). Bars: A, 50 μm; B, 10 μm; N, 200 μm; N′, 50 μm.
Figure 7.
Figure 7.
Model of neurogenesis progression in the extending axis. Stem zone cells all express Delta1 and experience mutual inhibition. Cells at the rostral edge of the stem zone experience less FGF and move out of this region into the forming neural tube (transition zone). Transition zone cells mix with recently arrived stem zone cells (Mathis et al. 2001), and as a result Delta1 expression begins to change from a uniform to a dispersed pattern. This is Phase I, and lateral inhibition is possible as differences between Notch signaling exist between neighboring cells. In Phase II, cells experience RA, and as a result FGF signaling declines (Diez del Corral et al. 2003) and hence cash4 and Delta1 levels are reduced. RA-dependent genes such as Ngns are now also expressed but are restricted to a few cells because lateral inhibition is already operating. Here Ngn expression promotes new Delta1 transcription leading regulated neuron production (1); some cells may also retain Delta1 expression from the stem zone and could differentiate into neurons (2).

References

    1. Artavanis Tsakonas, S., Rand, M.D., and Lake, R.J. 1999. Notch signaling: Cell fate control and signal integration in development. Science 284: 770-776. - PubMed
    1. Baonza, A. and Freeman, M. 2001. Notch signaling and the initiation of neural development in the Drosophila eye. Development 128: 3889-3898. - PubMed
    1. _____. 2005. Control of cell proliferation in the Drosophila eye by Notch signaling. Dev. Cell 8: 529-539. - PubMed
    1. Beck, C.W. and Slack, J.M. 1998. Analysis of the developing Xenopus tail bud reveals separate phases of gene expression during determination and outgrowth. Mech. Dev. 72: 41-52. - PubMed
    1. _____. 2002. Notch is required for outgrowth of the Xenopus tail bud. Int. J. Dev. Biol. 46: 255-258. - PubMed

Publication types