. 2005 Nov 14;33(20):6469-85.
doi: 10.1093/nar/gki953. Print 2005.

Long-oligomer microarray profiling in Neurospora crassa reveals the transcriptional program underlying biochemical and physiological events of conidial germination

Affiliations

Long-oligomer microarray profiling in Neurospora crassa reveals the transcriptional program underlying biochemical and physiological events of conidial germination

Takao Kasuga et al. Nucleic Acids Res. .

Abstract

To test the inferences of spotted microarray technology against a biochemically well-studied process, we performed transcriptional profiling of conidial germination in the filamentous fungus, Neurospora crassa. We first constructed a 70 base oligomer microarray that assays 3366 predicted genes. To estimate the relative gene expression levels and changes in gene expression during conidial germination, we analyzed a circuit design of competitive hybridizations throughout a time course using a Bayesian analysis of gene expression level. Remarkable consistency of mRNA profiles with previously published northern data was observed. Genes were hierarchically clustered into groups with respect to their expression profiles over the time course of conidial germination. A functional classification database was employed to characterize the global picture of gene expression. Consensus motif searches identified a putative regulatory component associated with genes involved in ribosomal biogenesis. Our transcriptional profiling data correlate well with biochemical and physiological processes associated with conidial germination and will facilitate functional predictions of novel genes in N.crassa and other filamentous ascomycete species. Furthermore, our dataset on conidial germination allowed comparisons to transcriptional mechanisms associated with germination processes of diverse propagules, such as teliospores of the phytopathogenic fungus Ustilago maydis and spores of the social amoeba Dictyostelium discoideum.


Figures

Figure 1
Figure 1
(A) The closed loop experimental design used for transcriptional profiling during conidial germination. Each arrow represents one competitive hybridization and the arrowhead points to Cy5-labeled cDNA. Micrographs of dormant conidia (0) and of cultures 0.5, 2, 4, 8 and 16 h after hydration are shown in panels. (B) Fraction of conidia with germ tubes. For each time point, 200 spores were scored for presence or absence of germ tubes. Confidence of 95% intervals is shown.
Figure 2
Figure 2
(A) Scatter plot of competitive hybridizations. The median pixel intensities of Cy3-labeled cDNA at 0 h was plotted against Cy5-labeled cDNA from 1 h. (B) The median pixel intensities for Cy3-labeled cDNA from 1 h was plotted against Cy5-labeled cDNA from 2 h. Diagonal lines were drawn over probes for the eight bacterial spike controls. (C) A comparison of changes in mRNA quantity during conidial germination at fixed amount of total RNA is shown. Filled squares: mRNA quantified by poly(A) protection assay [data from (49)]. Open circles: mRNA quantity estimated from microarray data by use of cRNA control spikes and BAGEL software. For both experiments, mRNA quantities were smallest in the dormant conidia, and were set to 1 in relation to other time points.
Figure 3
Figure 3
Proportion of genes that yielded mRNA profiles and annotation status of genes to which oligomers were designed and synthesized. From the left, bars are for total genes, all of the predicted genes with EST matches, genes with perithecial EST matches, genes with mycelial EST matches and genes with conidial EST matches. The total number of predicted genes in each category is shown in parentheses. Below the line indicates annotated genes with (open box) or without (shaded box) mRNA profiles. Above the line indicates unannotated genes with (open box) or without (shaded box) mRNA profiles. Number of corresponding genes is shown for each area.
Figure 4
Figure 4
Comparison of northern blot data (49) and microarray data for selected genes that are transcriptional regulated during conidial germination. Three µg/lane of total RNA was used for the northern data [from (49); used with permission*]. Bars are control cRNA-normalized estimates of relative expression level of mRNA transcripts obtained by BAGEL. An asymmetric 95% credible interval for each expression level is also shown. (A) con-8, a conidium-specific gene. (B) arg-2, a gene for arginine biosynthesis. (C) H4, a histone gene hH4-1. (D) cox-5, cytochrome-C oxidase chain V gene. Units for the ordinates are arbitrary. *Reprinted from (49) Page 121, Copyright (1991) with permission from Elsevier.
Figure 5
Figure 5
Hierarchical clustering of microarray data and identification of genes with similar transcriptional profiles. (A) A total of 1287 genes were clustered based on their expression profiles across the eight time points. Each gene's expression values were standardized to have mean zero and standard deviation of one across the eight time points. The lighter color in the cluster dendrogram is correlated with a higher expression level. Seven distinct clusters were visually selected, and the node separating each cluster is shown in the distance tree. (B) An average expression profile of genes within each cluster. To obtain each profile, a sum of each gene's expression values across the eight time points was standardized to 1. Next, time course values for all genes in each cluster were summed, and the summed value for the eight time points for each cluster was scaled to 1. The name designation of each cluster and representative profile is shown.
Figure 6
Figure 6
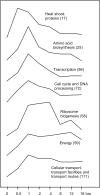
The re-scaled expression profiles of genes from specified functional categories within a cluster. The averaged profile contours were obtained as in Figure 5B for each group of genes.
Figure 7
Figure 7
Consensus sequence motif found in the promoter region of 34 putative ribosomal protein genes from the Max1∼4 cluster using BioProspector program (65) and WebLogo ().

References

    1. Collins F.S., Lander E.S., Rogers J., Waterston R.H., Conso I.H.G.S. Finishing the euchromatic sequence of the human genome. Nature. 2004;431:931–945. - PubMed
    1. Davis R.H. NEUROSPORA: Contributions of a Model Organism. NY: Oxford University Press; 2000.
    1. Davis R.H., Perkins D.D. Neurospora: a model of model microbes. Nature Rev. Genet. 2002;3:397–403. - PubMed
    1. Borkovich K.A., Alex L.A., Yarden O., Freitag M., Turner G.E., Read N.D., Seiler S., Bell-Pedersen D., Paietta J., Plesofsky N., et al. Lessons from the genome sequence of Neurospora crassa: tracing the path from genomic blueprint to multicellular organism. Microbiol. Molec. Biol. Rev. 2004;68:1–108. - PMC - PubMed
    1. Bistis G.N., Perkins D.D., Read N.D. Cell types of Neurospora crassa. Fungal Genet. Newslett. 2003;50:17–19.

Publication types

MeSH terms