Comparative Study
. 2005 Nov 29;102(48):17348-53.
doi: 10.1073/pnas.0508584102. Epub 2005 Nov 15.

Probing structural heterogeneities and fluctuations of nucleic acids and denatured proteins

Affiliations
Comparative Study

Probing structural heterogeneities and fluctuations of nucleic acids and denatured proteins

Ted A Laurence et al. Proc Natl Acad Sci U S A. .

Abstract

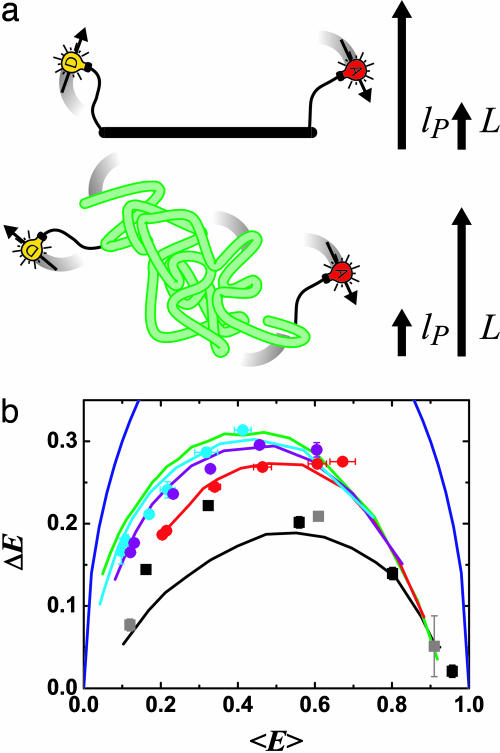
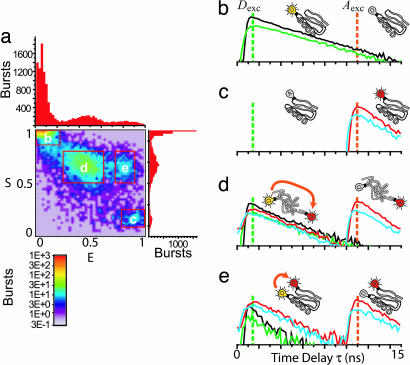
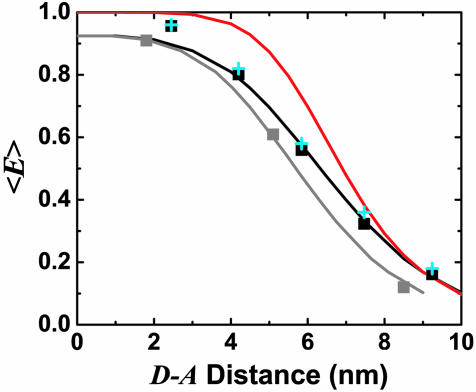
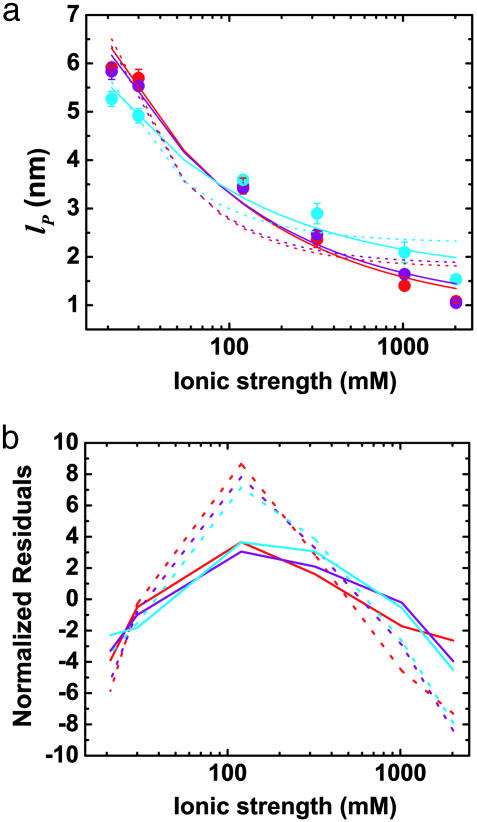
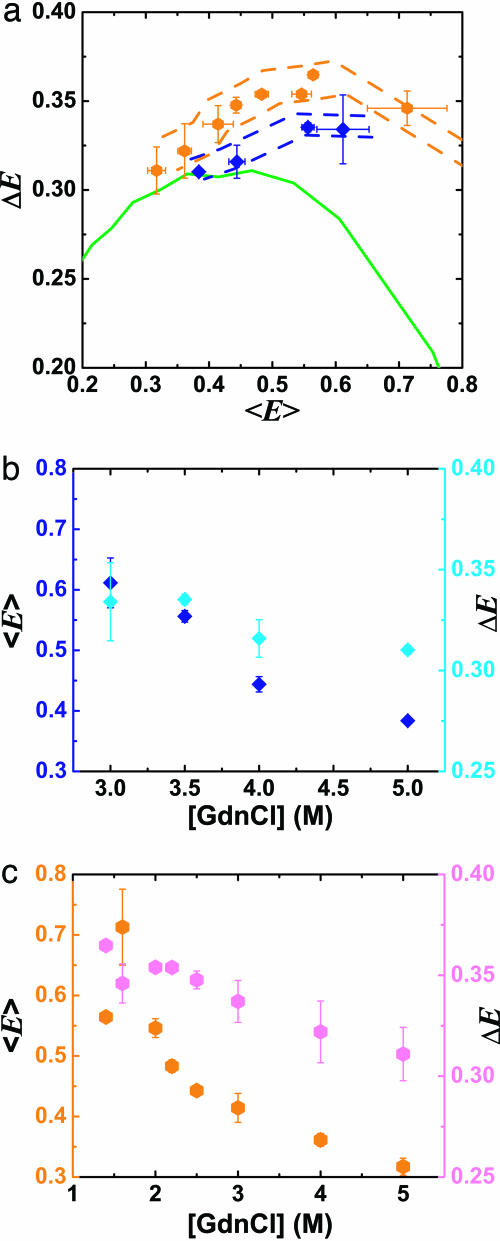
We study protein and nucleic acid structure and dynamics using single-molecule FRET and alternating-laser excitation. Freely diffusing molecules are sorted into subpopulations based on single-molecule signals detected within 100 micros to 1 ms. Distance distributions caused by fluctuations faster than 100 micros are studied within these subpopulations by using time-correlated single-photon counting. Measured distance distributions for dsDNA can be accounted for by considering fluorophore linkers and fluorophore rotational diffusion, except that we find smaller fluctuations for internally labeled dsDNA than DNA with one of the fluorophores positioned at a terminal site. We find that the electrostatic portion of the persistence length of short single-stranded poly(dT) varies approximately as the ionic strength (I) to the -1/2 power (I(-1/2)), and that the average contribution to the contour length per base is 0.40-0.45 nm. We study unfolded chymotrypsin inhibitor 2 (CI2) and unfolded acyl-CoA binding protein (ACBP) even under conditions where folded and unfolded subpopulations coexist (contributions from folded proteins are excluded by using alternating-laser excitation). At lower denaturant concentrations, unfolded CI2 and ACBP are more compact and display larger fluctuations than at higher denaturant concentrations where only unfolded proteins are present. The experimentally measured fluctuations are larger than the fluctuations predicted from a Gaussian chain model or a wormlike chain model. We propose that the larger fluctuations may indicate transient residual structure in the unfolded state.


Figures

Fig. 1.
Fig. 1.
FRET reveals distance distributions related to polymer flexibility. (a) Distance distributions in polymers are probed by using FRET from a donor fluorophore (D; yellow bulb) to an acceptor fluorophore (A; red bulb). A rigid rod (Upper, black; with contour length, L, much smaller than persistence length, lP) is distinguished from a flexible Gaussian chain (Lower, green; L » lP) and intermediate cases (LlP; not shown) by differences in the distributions of energy transfer efficiency, E, caused by distributions in DA distances. Flexible fluorophore linkers and rotational diffusion of the fluorophores on similar time scales to fluorescence also affect the measurements. (b) Experimental data and simulations of E distributions [P(E)] of DA-labeled polymers summarized as plots of standard deviation ΔE vs. mean efficiency 〈E 〉. Simulations (with R0 = 6.9 nm): (i) a rigid rod with linkers and fluorophore rotational diffusion lifetime τr similar to the donor fluorescence lifetime τfr ≈ τf) (solid black); (ii) wormlike chains with L = 12 nm (solid red), L = 16 nm (solid purple), and L = 20 nm (solid cyan), each with varying lP, τr ≈ τf, and linkers; (iii) a Gaussian chain with varying L × lP, τr ≈ τf, and linkers (solid green); and (iv) a hypothetical polymer with the largest possible fluctuations formula image (solid blue). Data: dsDNA with 7-, 12-, 17-, 22-, and 27-bp DA separations (black squares); dsDNA with 5-, 15-, and 25-bp DA separations (gray squares, internally labeled); ssDNA at varying salt concentration [(dT)30, red circles; (dT)40, purple circles; (dT)50, cyan circles]. For all figures, the data points are averages of two or three independent experiments, and error bars are standard errors of the mean.
Fig. 2.
Fig. 2.
Time-resolved FRET curves for subpopulations extracted by using nsALEX. (a) Photon burst histogram resulting from single molecules of DA-labeled C1–C53 CI2 mutant diffusing through laser spot in 4 M GdnCl. E and S are calculated for each burst and placed in the histogram. Four species are detected, and their corresponding time-resolved fluorescence decay curves are extracted (shown in be): parallel D decay (black); perpendicular D decay (green); parallel A decay (red); and perpendicular A decay (cyan). (b) Proteins with D only emit only after Dexc (leakage of D into A channel removed for clarity). (c) Proteins with A only emit only after Aexc (direct excitation of A by Dexc removed for clarity). (d) Unfolded proteins labeled with D and A emit D and A fluorescence after Dexc pulse (ratio of intensities and lifetimes depend on FRET efficiency) and emit A fluorescence after Aexc. (e) Folded proteins labeled with D and A emit similarly to case d, except with a higher relative intensity of A compared with D after the Dexc pulse, and with a shorter D lifetime, indicating a higher E due to shorter average distance.
Fig. 3.
Fig. 3.
E 〉 vs. distance between attachment points for D and A for dsDNA with 7-, 12-, 17-, 22-, and 27-bp separations (black squares) and dsDNA with 5-, 15-, and 25-bp separations (gray squares). 〈E 〉 calculated from calibrated single-molecule intensity ratios rather than fluorescence lifetime information are shown as cyan crosses (23). FRET model [E = 1/1 + (R/R0)6] with measured R0 = 69 Å and 〈κ2 〉= 2/3 (solid red) and simulation accounting for linkers and the measured slower rotational diffusion (formula image ns and formula image ns; solid black) are shown. Simulations were adjusted to R0 = 62 Å to match gray squares.
Fig. 4.
Fig. 4.
Effects of ionic strength on ssDNA flexibility. (a) Extracted persistence length, lP, vs. ionic strength ([NaCl] + [Tris buffer]) for (dT)30 (red circles), (dT)40 (purple circles), and (dT)50 (cyan circles). Solid red, purple, and cyan lines: respective fits to model, formula image with constant, intrinsic persistence length formula image and electrostatic contribution formula image. Dotted lines: respective fits to model, formula image, where the electrostatic contribution varies as formula image. (b) Residuals plotted for fits in a. Fits were weighted by using error value averaged over all data points.
Fig. 5.
Fig. 5.
Effects of denaturant concentration on distance distributions of unfolded CI2 and ACBP. (a) ΔE vs. 〈E 〉 for the unfolded subpopulation of 1–53 CI2 mutant ([GdnCl] = 3, 3.5, 4, and 5 M; blue diamonds) and 17–86 ACBP mutant ([GdnCl] = 1.4, 1.6, 2, 2.2, 2.5, 3, 4, and 5 M; orange hexagons) at varying denaturant concentrations. Using single-molecule burst analysis, nsALEX excludes contributions from the folded subpopulations of CI2 and ACBP. Simulations for the Gaussian chain with varying L × lP dye linkers are shown in solid green. Dashed blue and orange lines: outliers denoting maximum possible errors due to photophysical artifacts (see Assessment of Photophysical Artifacts in Supporting Appendix). (b) Same data as in a, plotted as 〈E 〉 (blue diamonds) and ΔE (cyan diamonds) vs. [GdnCl] for unfolded CI2. (c) Same data as in a, plotted as 〈E 〉 (orange hexagons) and ΔE (magenta hexagons) vs. [GdnCl] for unfolded ACBP.

References

    1. de Gennes, P. G. (1979) Nature 282, 367–370.
    1. Barrat, J.-L. & Joanny, J.-F. (1996) in Advances in Chemical Physics, eds. Prigogine, I. & Rice, S. A. (Wiley, New York), Vol. 94, pp. 1–65.
    1. Dill, K. A. & Chan, H. S. (1997) Nat. Struct. Biol. 4, 10–19. - PubMed
    1. Eaton, W. A., Munoz, V., Hagen, S. J., Jas, G. S., Lapidus, L. J., Henry, E. R. & Hofrichter, J. (2000) Annu. Rev. Biophys. Biomol. Struct. 29, 327–359. - PMC - PubMed
    1. Cannavacciuolo, L. & Pedersen, J. (2002) J. Chem. Phys. 117, 8973–8982.

Publication types