. 2005 Nov 15;65(22):10255-64.
doi: 10.1158/0008-5472.CAN-05-1714.

The p53 tumor suppressor network is a key responder to microenvironmental components of chronic inflammatory stress

Affiliations

The p53 tumor suppressor network is a key responder to microenvironmental components of chronic inflammatory stress

Frank Staib et al. Cancer Res. .

Abstract

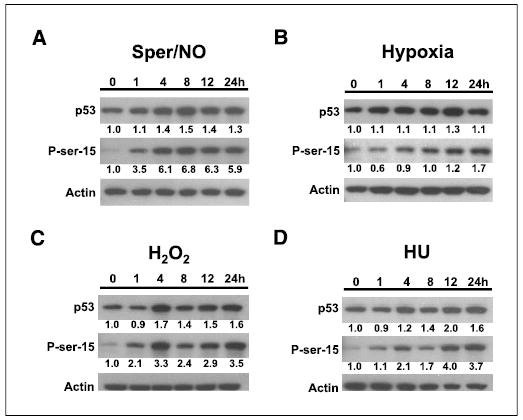
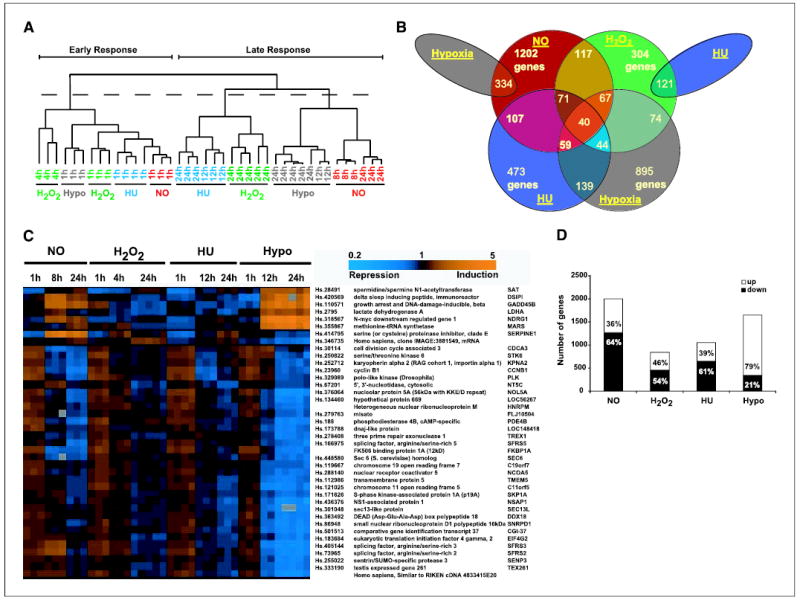
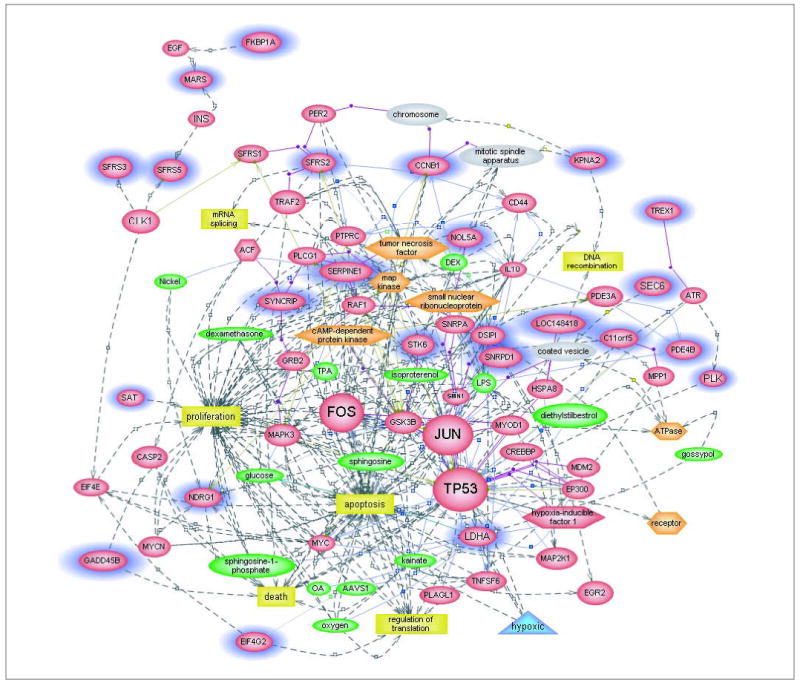
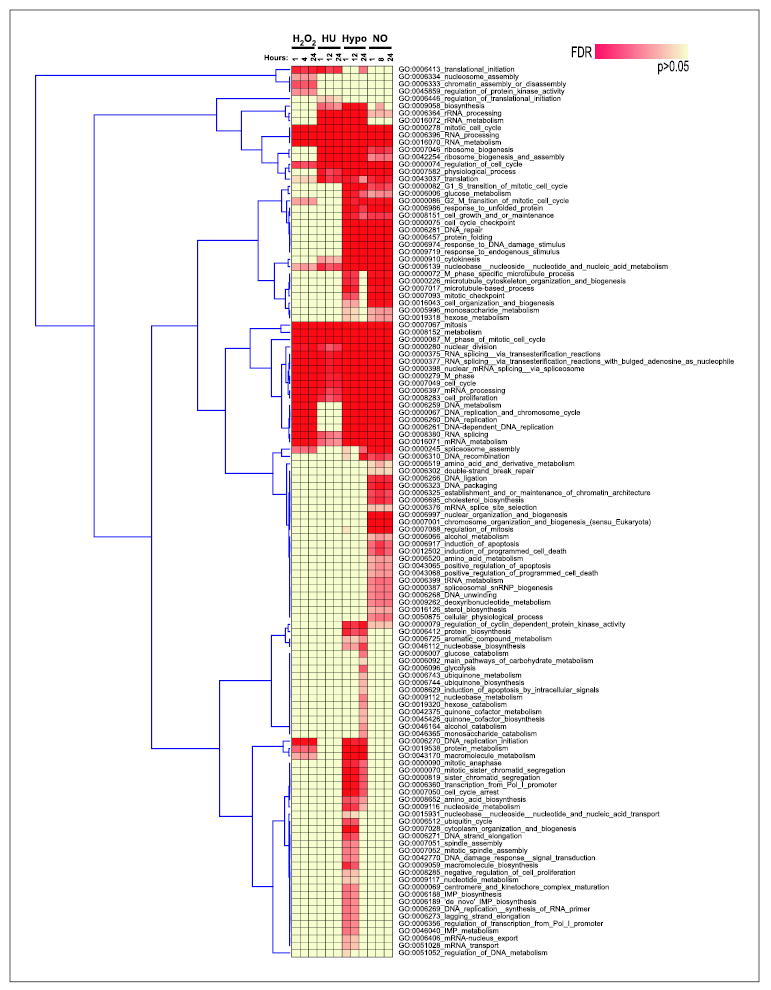
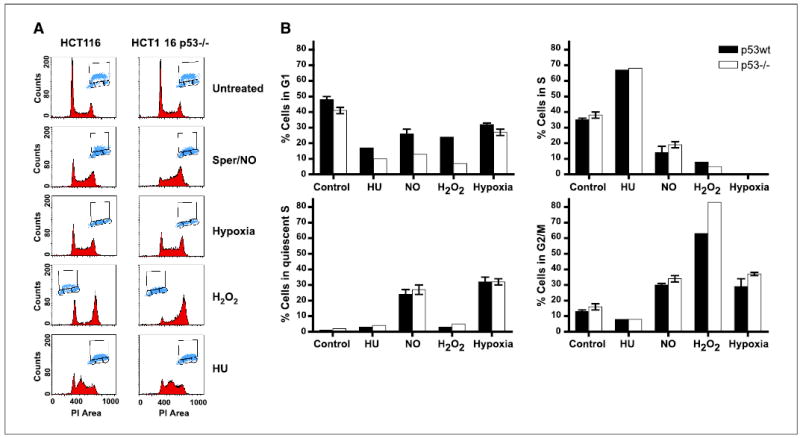
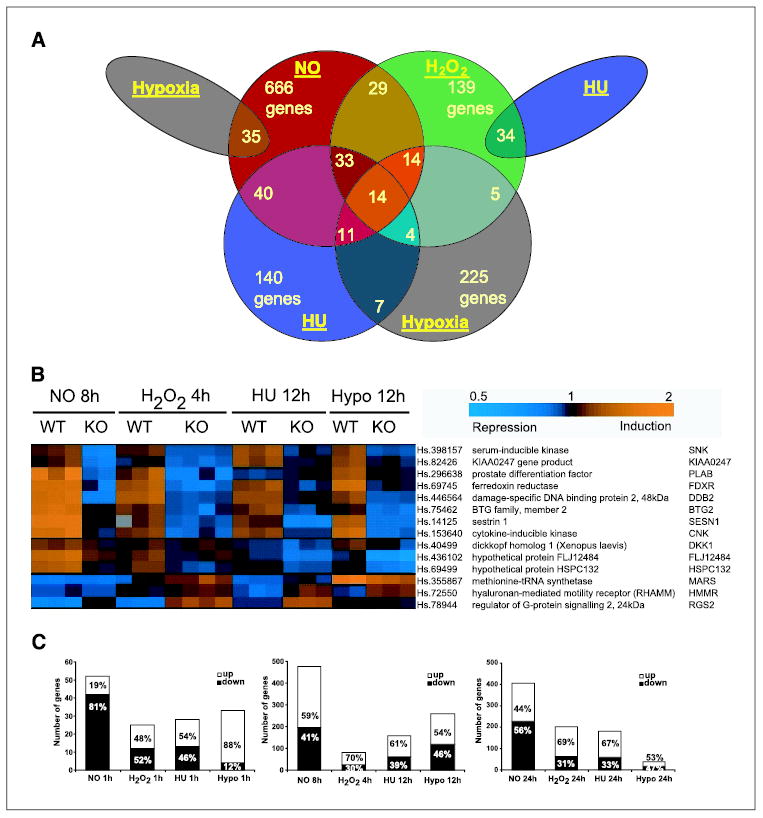
Activation of the p53 network plays a central role in the inflammatory stress response associated with ulcerative colitis and may modulate cancer risk in patients afflicted with this chronic disease. Here, we describe the gene expression profiles associated with four microenvironmental components of the inflammatory response (NO*, H2O2, DNA replication arrest, and hypoxia) that result in p53 stabilization and activation. Isogenic HCT116 and HCT116 TP53-/- colon cancer cells were exposed to the NO* donor Sper/NO, H2O2, hypoxia, or hydroxyurea, and their mRNA was analyzed using oligonucleotide microarrays. Overall, 1,396 genes changed in a p53-dependent manner (P < 0.001), with the majority representing a "unique" profile for each condition. Only 14 genes were common to all four conditions. Included were eight known p53 target genes. Hierarchical sample clustering distinguished early (1 and 4 hours) from late responses (8, 12, and 24 hours), and each treatment was differentiated from the others. Overall, NO* and hypoxia stimulated similar transcriptional responses. Gene ontology analysis revealed cell cycle as a key feature of stress responses and confirmed the similarity between NO* and hypoxia. Cell cycle profiles analyzed by flow cytometry showed that NO* and hypoxia induced quiescent S-phase and G2-M arrest. Using a novel bioinformatic algorithm, we identified several putative p53-responsive elements among the genes induced in a p53-dependent manner, including four [KIAA0247, FLJ12484, p53CSV (HSPC132), and CNK (PLK3)] common to all exposures. In summary, the inflammatory stress response is a complex, integrated biological network in which p53 is a key molecular node regulating gene expression.


Figures

Figure 1
Figure 1
Western blot of p53 accumulation and posttranscriptional modification. HCT116 cells were exposed to (A) 1 mmol/L Sper/NO, (B) hypoxia, (C) 0.1 mmol/L H2O2, or (D) 1.5 mmol/L hydroxyurea (HU) for the indicated times (hours). Numbers below the blots indicate densitometry values as a ratio relative to the values of the untreated (0 hour) samples.
Figure 2
Figure 2
Time course of treatment-specific gene expression profiles as determined by univariate F test (P < 0.001) and controlled by a global permutation test. A, hierarchical clustering of samples based on the compiled list of 4,047 genes identified by BRB Array Tools as changing significantly over the time course under any exposure in HCT116 TP53wt. For calculation of the robustness index, the cluster was cut into three trees as indicated by the black-dashed horizontal line (R index = 1.0 for each tree). B, Venn diagram depicting the number of overlapping or treatment-specific genes identified by F test as changing significantly over the time course for each exposure. There are 40 genes whose expression overlaps with all four exposures. C, hierarchical clustering of the 40 genes from the center of the Venn diagram, using all TP53wt hybridization replicates for each time point and treatment. Unigene number, gene name, and description (right). Color-coded degree of expression (0.2- to 5-fold) relative to the untreated samples (top right). D, the total number of significant differentially expressed, nonoverlapping genes of each treatment (F test) is divided into up-regulated (white columns) and down-regulated (black columns) genes.
Figure 3
Figure 3
BAN using PathwayAssist for the 40 genes with gene expression changes common to all four exposures. The colors represent PathwayAssist categories: red, gene; yellow, cell process; green, small molecule; orange, protein functional class; gray, cell object; blue, treatment. Only genes (blue halos) that could be linked from the 40 selected genes to other genes, functions, or categories are included in the BAN. Among the genes introduced by PathwayAssist that link the genes of interest and/or their categories were TP53 and the early-response genes, JUN and FOS. Cellular processes, such as “apoptosis, ” “death,” and “proliferation,” are also incorporated into the network, as were the nodes for “hypoxic treatment” and “HIF-1 complex.”
Figure 4
Figure 4
Functional categorization by High-Throughput GoMiner based on the Gene Ontology of the sum of 4,047 differentially expressed genes from Fig. 2A. These data were visualized by the publicly available software “Genesis” using the Pearson correlation and complete linkage clustering of the significant Gene Ontology categories. Categories with similar false discovery rate values tend to cluster together. False discovery rate is color coded (top right).
Figure 5
Figure 5
Functional cell cycle analysis by fluorescence-activated cell sorting. A, HCT116 and HCT116 TP53−/− cells were labeled with BrdUrd during the last 30 minutes of a 24-hour exposure as indicated, followed by double staining with FITC-conjugated anti-BrdUrd antibody and propidium iodide. Insets, gating used to calculate the fraction of cells in each phase of the cell cycle. B, columns, percentage of cells in each cell cycle phase of triplicate samples from one of two independent experiments; bars, SD. Black columns, HCT116 cells; white columns, HCT116 TP53−/− cells.
Figure 6
Figure 6
Analysis of p53-mediated stress-related genes as determined by the univariate t test with randomized variance model. A, Venn diagram based on the cumulative 1,396 genes that discriminate between p53wt and p53−/− cells at any time point in any treatment identified by paired comparison of the expression profile of p53wt and p53−/− cells at individual time points of exposure. There are 14 genes whose expression is dependent on the presence of p53 for all exposures. B, hierarchical clustering of the 14 overlapping genes. This cluster consists of the replicate arrays of the corresponding time points with maximal p53 accumulation for each treatment (Fig. 1). Color-coded degree of expression (0.5- to 2-fold) relative to the untreated samples (top right). C, total numbers of genes used to generate the Venn diagram are shown as ratio of up-regulated (white columns) and down-regulated (black columns). The genes are divided into 1-hour (left), intermediate (middle), and 24-hour (right) time points.

Similar articles

Cited by

References

    1. Hofseth LJ, Hussain SP, Harris CC. p53: 25 years after its discovery. Trends Pharmacol Sci. 2004;25:177–81. - PubMed
    1. Hussain SP, Hofseth LJ, Harris CC. Radical causes of cancer. Nat Rev Cancer. 2003;3:276–85. - PubMed
    1. Li CQ, Robles AI, Hanigan CL, et al. Apoptotic signaling pathways induced by nitric oxide in human lymphoblastoid cells expressing wild-type or mutant p53. Cancer Res. 2004;64:3022–9. - PubMed
    1. Hofseth LJ, Saito S, Hussain SP, et al. Nitric oxide-induced cellular stress and p53 activation in chronic inflammation. Proc Natl Acad Sci U S A. 2003;100:143–8. - PMC - PubMed
    1. Hussain SP, Amstad P, Raja K, et al. Increased p53 mutation load in noncancerous colon tissue fulcerative colitis: a cancer-prone chronic inflammatory disease. Cancer Res. 2000;60:3333–7. - PubMed

Publication types

MeSH terms