. 2006 Mar 23;25(13):1871-86.
doi: 10.1038/sj.onc.1209211.

Critical interactions between TGF-beta signaling/ELF, and E-cadherin/beta-catenin mediated tumor suppression

Affiliations

Critical interactions between TGF-beta signaling/ELF, and E-cadherin/beta-catenin mediated tumor suppression

V Katuri et al. Oncogene. .

Erratum in

Abstract

Inactivation of the transforming growth factor-beta (TGF-beta) pathway occurs often in malignancies of the gastrointestinal (GI) system. However, only a fraction of sporadic GI tumors exhibit inactivating mutations in early stages of cancer formation, suggesting that other mechanisms play a critical role in the inactivation of this pathway. Here, we show a wide range of GI tumors, including those of the stomach, liver and colon in elf+/- and elf+/- / Smad4+/- mutant mice. We found that embryonic liver fodrin (ELF), a beta-Spectrin originally identified in endodermal stem/progenitor cells committed to foregut lineage, possesses potent antioncogenic activity and is frequently inactivated in GI cancers. Specifically, E-cadherin accumulation at cell-cell contacts and E-cadherin-beta-catenin-dependent epithelial cell-cell adhesion is disrupted in elf+/- / Smad4+/- mutant gastric epithelial cells, and could be rescued by ectopic expression of full-length elf, but not Smad3 or Smad4. Subcellular fractionation revealed that E-cadherin is expressed mainly at the cell membrane after TGF-beta stimulation. In contrast, elf+/- / Smad4+/- mutant tissues showed abnormal distribution of E-cadherin that could be rescued by overexpression of ELF but not Smad3 or Smad4. Our results identify a group of common lethal malignancies in which inactivation of TGF-beta signaling, which is essential for tumor suppression, is disrupted by inactivation of the ELF adaptor protein.


Figures
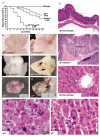
Figure 1
Figure 1
Wide range of gastrointestinal tumors in elf+/− and elf+/−/Smad4+/− mice. (a) Survival of elf+/−, Smad4+/− and elf+/−/Smad4+/− mice. Kaplan–Meier tumor-free survival curves of wild type (control), elf+/−, Smad4+/− and elf+/−/Smad4+/− (experimental) animals. Increased mortality of elf+/−/Smad4+/− mutants is demonstrated. (b–g) Macroscopic analysis of tumor development in elf+/−/Smad4+/−and elf+/− mice. Gastric tumors (b–d), colon tumor (e, arrow) in elf+/−/Smad4+/− mice and hepatocellular cancer in elf+/− mice (f–g). Pictures in (bg) are same magnification of (g) shown with scale bars. (h–i) H&E stained sections of normal gastric mucosa (h), and hyperplastic mucosa in gastric tumors (i) obtained from elf+/−/Smad4+/− mice. (j–l) H&E stained sections of normal liver (j) and hepatocellular carcinoma (k–l) obtained from elf+/− mice showing dysplasia, nuclear changes, variability in the nuclear morphology (k, arrow) and abnormal mitoses (l, arrow).
Figure 2
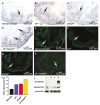
Figure 2
Growth regulation of gastric epithelial cells and tumors by ELF and Smad4. (a–d) BrdU incorporation in nuclei of replicating cells in 18.5 dpc fetal mouse stomach. Increased BrdU incorporation is demonstrated in elf+/−/Smad4+/− mutants (d, arrows) compared to normal wild-type gastric tissues (a, arrow), elf+/− (b, arrow) and Smad4+/− tissues (c, arrow). (e–h) Detection of apoptotic cells by TUNEL. Fluorescent micrographs of newborn mice stomach tissue from wild type (e, arrow), elf+/− (f, arrow) and Smad4+/− tissues (g, arrow) and elf+/−/Smad4+/− (h, arrow) are shown. TUNEL-positive nuclei (arrows) are stained in green. In the newborn wild-type control mouse, apoptosis is noted in gastric epithelial cells on the surface of the glandular structures (e, arrow). In comparison, only a few apoptotic cells are seen in elf+/−/Smad4+/− mutant gastric epithelium (h). (i) Quantitative analysis of gastric epithelial cell proliferation. The labeling index was calculated as a percentage of BrdU-labeled cells in the total epithelial cell population from 18.5 dpc fetal gastric tissue. Mean±s.d. of five fetuses. (j) Immunoblot analysis of Smad4+/− (lane 1) and elf+/−/Smad4+/− (lanes 2 and 3) gastric tumor cells lines. Immunoblot analysis reveals loss of ELF expression (lanes 1–3) in both cell lines, and reduced expression of Smad4 only in elf+/−/Smad4+/− gastric tumor cell lines (lanes 2 and 3) compared to wild-type controls (lane 4).
Figure 3
Figure 3
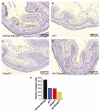
Detection of apoptotic cells by anti-caspase 3. (a–d) In the newborn wild-type control mouse, apoptosis is noted in gastric epithelial cells on the surface of the glandular structures (a, arrows), while few apoptotic cells are seen in elf+/−, Smad4+/−, and elf+/−/Smad4+/− mutant gastric epithelium, respectively (b–d). (e) Quantitative analysis of gastric epithelial apoptosis. The labeling index was calculated as total number of caspase 3-labeled cells in the 18.5 dpc fetal gastric tissue and showed apoptotic cells were reduced in elf+/−/Smad4+/− when compared to controls.
Figure 4
Figure 4
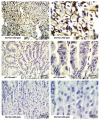
Disruption of ELF results in loss of E-cadherin expression in elf+/−/Smad4+/− gastric tissue. (a–b) Immunohistochemical labeling of E-cadherin in elf +/−/Smad4+/− and wild-type control gastric tissue. Panel a (low power view) and panel b (high power view of b) exhibit normal E-cadherin (brown) expression at cell–cell contact sites in wild-type gastric tissue (arrow). (c–d) Low power (c) and high power view (d) shows diminished E-cadherin expression and absence at cell–cell contact sites in elf +/−/Smad4+/− gastric tissue. (e–f) Negative control (labeled with secondary antibody only).
Figure 5
Figure 5
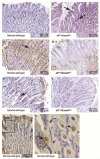
ELF loss of function results in aberrant expression of β-catenin, H/K-ATPase and RUNX. (a, b) Immunohistochemical staining of β-catenin expression is abnormal in elf+/−/Smad4+/− gastric tissue (b, arrows) compared to the wild type (a). (c–d) Reduced expression of H/K-ATPase is seen in elf+/−/Smad4+/− gastric tissue (d) when compared to normal wild-type gastric tissue (c, arrow). (e–f) Similarly, Runx expression is reduced in elf+/−/Smad4+/− gastric tissue (f) compared to wild-type controls (e, arrow). (g–h) Expression of anti-ELF in wild-type gastric tissue. Boxed area in low power view (g) is enlarged and shown in (h). Strong ELF expression is seen in parietal cells (h, arrow) and in surface mucous cells (h, arrow head).
Figure 6
Figure 6
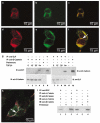
ELF colocalizes with E-cadherin at cell–cell contact sites. (a–f) Colocalization of ELF and E-cadherin in TGF-β signaling. Gastric cells were cultured with TGF-β1 for 80 min followed by protein colocalization visualized by confocal microscopy. (a–c) ELF localization is shown with ELF antibody and Rhodamine-conjugated goat anti rabbit IgG (a, red), E-cadherin is seen with appropriate monoclonal antibodies and FITC-conjugated goat anti-mouse IgG (b, green) and overlay (c) demonstrates weak colocalization of ELF with E-cadherin at cell–cell contact sites. (d–f) Upon stimulation by TGF-β1, ELF (d, red) colocalizes with E-cadherin (e) shown in yellow at cell–cell contact sites (f, arrow). (g) Interactions of ELF, E-cadherin in gastric cells upon TGF-β stimulation. Coimmunoprecipitation assays using cell extracts from normal gastric cells, unstimulated or stimulated with TGF-β for different time points (15′, 30′ and 1 h) were subjected to immunoprecipitation (IP) with preimmune sera, antibody against ELF and then immunoblotted (IB) with monoclonal antibody against E-cadherin, and vice versa. In the presence of TGF-β, coprecipitation of ELF with E-cadherin is demonstrated only at 1 h (lanes 4 and 10) when compared to the controls (lanes 6 and 12). In the absence of TGF-β, interaction between ELF and E-cadherin was not seen (lanes 1 and 7). Immunoblot analysis demonstrates E-cadherin or ELF expression at all time points (lanes 1–4; 7–10) when compared to the negative controls (lanes 5 and 11), respectively. (h) ELF (red) colocalizes with E-cadherin (green) and Smad3 (blue) at 80 min, with TGF-β treatment (cell–cell contact sites, white). (i) ELF interactions with α and β-catenin in wild-type MEFs. ELF interacts with α-catenin (lane 1) and β-catenin (lane 4).
Figure 7
Figure 7
E-cadherin interactions with Smad3 and Smad4. (a) Embryonic tissue lysates were immunoprecipitated (IP) with preimmune sera, and antibody to E-cadherin, and then immunoblotted (IB) with either a monoclonal or polyclonal antibody to Smad3. Coprecipitation of E-cadherin–Smad3 is observed in wild-type tissue lysates (lanes 4 and 5) when compared to the positive controls (lanes 1 and 2). In contrast, E-cadherin–Smad3 interactions were undetectable in mutants (lanes 6 and 7). (b) E-cadherin interacts with Smad4 in wild-type embryonic tissue lysates (lanes 4 and 5) when compared to the positive controls (lanes 1 and 2). E-cadherin-Smad4 interactions were undetectable in mutants (lanes 6 and 7).
Figure 8
Figure 8
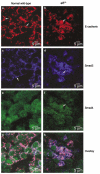
Loss of ELF function results in mislocalization of E-cadherin, Smad3 and Smad4. (a–f) Immunofluorescent confocal microscopy shows normal E-cadherin (a) expression at cell–cell contact sites (rhodamine), Smad3, cytosolic expression (c, cy5) and Smad4, cytosolic expression (e, FITC) in E11.5 wild-type gastrointestinal tissues tissue (arrow). E-cadherin (b), Smad3 (d) and Smad4 (f) distribution is abnormal in E11.5 elf−/− gastrointestinal tissue. (g-h) E-cadherin and Smad3 colocalization appears as pink (g, arrows) in E11.5 wild-type liver tissue, but not with Smad4. Scale bar (a–h) 5 μm.
Figure 9
Figure 9
ELF rescues E-cadherin/β-catenin substrate-independent cell–cell adhesion. (a–c) Analysis of ELF in a quantitative, functional adhesion assay. Normal gastric cells (a), elf+/−/Smad4+/− gastric cancer cell lines transfected with pcDNA3.1 DNA only (b), and elf+/−/Smad4+/− gastric cancer cell lines transfected with cDNA encoding full-length elf (c). Graphs show the percentage of cells in clusters of 0–10 cells (gray), 11–50 cells (dark gray), and >50 cells (white) at the time points indicated, before and after trituration. Photographs are representative fields at 0 and 6 h, before and after trituration.
Figure 10
Figure 10
Rescue of E-cadherin expression in elf+/−/Smad4+/− gastric cancer cells. (a) Immunofluorescent confocal microscopy showing normal E-cadherin distribution (Rhodamine) in wild-type gastric cells (arrow) transfected with pcDNA3.1 DNA only. Nuclei are visualized with TOPRO-3 (Blue). (b) E-cadherin expression is decreased and aberrant in elf+/−/Smad4+/− gastric cancer cells transfected with pcDNA3.1 DNA only. (c) E-cadherin expression is rescued by overexpression of ELF (arrow). (d–f) Subcellular localization of E-cadherin expression in elf+/−/Smad4+/− gastric cancer cells after over expression of full-length elf. (d) Localization of E-cadherin protein by subcellular fractionation. Cells were lysed and subcellular fractionation was performed as described in Materials and methods. Each fraction (membrane, cytosol and nuclei) was subjected to immunoblot analysis using anti-E-cadherin antibody. Upon stimulation with TGF-β1 in wild-type gastric cells (lane 2), E-cadherin is localized mainly in the membrane compared to unstimulated cells (lane 1). With or without TGF-β1 stimulation, E-cadherin expression is not restored in the membrane in elf+/−/Smad4+/− gastric cancer cells transfected with pcDNA3.1 DNA only (lanes 3 and 6). In contrast, E-cadherin expression is rescued by overexpression of full-length elf, upon TGF-β1 stimulation (lane 4) when compared to the control (without TGF-β1 stimulation, lane 5). At the same time, cytosolic expression is low. In all cases, E-cadherin expression is absent in the nuclear fractions. (e–f) Quantitative analysis of E-cadherin expression in membrane and cytosolic fractions of wild-type and elf+/−/Smad4+/− gastric cancer cells with and without TGF-β1 stimulation is shown in the bar graph. IDV: integrated density value. (g) Loss of ELF β-Spectrin in elf mutant mouse embryos. Immunoblot analysis of E13.5 or E15.5 embryo lysates with peptide-specific polyclonal antibody that recognize all β-2-Spectrins demonstrates loss of ELF (200 kDa) in elf−/− mutant tissues. In contrast, β-2-Spectrin members are present (274 and 240 kDa, arrows) in elf−/− mutant tissues. All three proteins are expressed in normal wild-type control.

Similar articles

Cited by

References

    1. Attisano L, Wrana JL. Curr Opin Cell Biol. 2000;12:235–243. - PubMed
    1. Bennett V, Baines AJ. Physiol Rev. 2001;81:1353–1392. - PubMed
    1. Brooks-Wilson AR, Kaurah P, Suriano G, Leach S, Senz J, Grehan N, et al. J Med Genet. 2004;41:508–517. - PMC - PubMed
    1. Derynck R, Zhang YE. Nature. 2003;425:577–584. - PubMed
    1. Dong C, Li Z, Alvarez R, Jr, Feng XH, Goldschmidt-Clermont PJ. Mol Cell. 2000;5:27–34. - PubMed

Publication types

MeSH terms