

Effects of insulin and cytosolic redox state on glucose production pathways in the isolated perfused mouse liver measured by integrated 2H and 13C NMR
- PMID: 16288601
- PMCID: PMC1408677
- DOI: 10.1042/BJ20051174
Effects of insulin and cytosolic redox state on glucose production pathways in the isolated perfused mouse liver measured by integrated 2H and 13C NMR
Erratum in
- Biochem J. 2006 May 1;395(3):663
Abstract
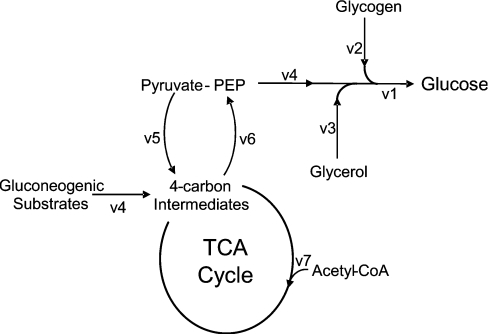
A great deal is known about hepatic glucose production and its response to a variety of factors such as redox state, substrate supply and hormonal control, but the effects of these parameters on the flux through biochemical pathways which integrate to control glucose production are less clear. A combination of 13C and [2H]water tracers and NMR isotopomer analysis were used to investigate metabolic fluxes in response to altered cytosolic redox state and insulin. In livers isolated from fed mice and perfused with a mixture of substrates including lactate/pyruvate (10:1, w/w), hepatic glucose production had substantial contributions from glycogen, PEP (phosphoenolpyruvate) and glycerol. Inversion of the lactate/pyruvate ratio (1:10, w/w) resulted in a surprising decrease in the contribution from glycogen and an increase in that from PEP to glucose production. A change in the lactate/pyruvate ratio from 10:1 to 1:10 also stimulated flux through the tricarboxylic acid cycle (2-fold), while leaving oxygen consumption and overall glucose output unchanged. When lactate and pyruvate were eliminated from the perfusion medium, both gluconeogenesis and tricarboxylic-acid-cycle flux were dramatically lower. Insulin lowered glucose production by inhibiting glycogenolysis at both low and high doses, but only at high levels of insulin did gluconeogenesis or tricarboxylic-acid-cycle flux tend towards lower values (P<0.1). Our data demonstrate that, in the isolated mouse liver, substrate availability and cellular redox state have a dramatic impact on liver metabolism in both the tricarboxylic acid cycle and gluconeogenesis. The tight correlation of these two pathways under multiple conditions suggest that interventions which increase or decrease hepatic tricarboxylic-acid-cycle flux will have a concomitant effect on gluconeogenesis and vice versa.
Figures


References
-
- Sistare F. D., Haynes R. C., Jr The interaction between the cytosolic pyridine nucleotide redox potential and gluconeogenesis from lactate/pyruvate in isolated rat hepatocytes. Implications for investigations of hormone action. J. Biol. Chem. 1985;260:12748–12753. - PubMed
-
- Khan S., O'Brien P. J. Role of the cellular redox state in modulating acute ethanol toxicity in isolated hepatocytes. Clin. Biochem. 1999;32:585–589. - PubMed
-
- Ueda K., Takahashi M., Yamada T., Kinoshita M., Ozawa K. Evaluation of changes in hepatic energy metabolism during exercise by ketone body ratio in humans. J. Cardiol. 1997;29:95–102. - PubMed
Publication types
MeSH terms
Substances
Grants and funding
LinkOut - more resources
Full Text Sources
Medical
Miscellaneous