Comparative Study
. 2005 Nov 16;25(46):10607-16.
doi: 10.1523/JNEUROSCI.2017-05.2005.

Serotoninergic modulation of chloride homeostasis during maturation of the locomotor network in zebrafish

Affiliations
Comparative Study

Serotoninergic modulation of chloride homeostasis during maturation of the locomotor network in zebrafish

Edna Brustein et al. J Neurosci. .

Abstract

During development, neural networks progress through important functional changes such as the generation of spontaneous activity, the expression of a depolarizing chloride gradient, and the appearance of neuromodulation. Little is known about how these processes are integrated to yield mature behaviors. We showed previously that, during the maturation of the locomotor network of the zebrafish, endogenous serotonin (5HT) increased motor activity by reducing intervals of inactivity, without affecting the active swim periods that are the target of 5HT in other and more mature preparations. Because membrane properties were constant during the rest intervals, we examined here whether 5HT modulates chloride homeostasis. We compared the effects of blocking (inward) chloride cotransport with bumetanide to the effects of 5HT and its antagonists, both behaviorally by video imaging and cellularly by whole-cell and gramicidin-perforated patch recordings. Bumetanide mimicked the effects of 5HT antagonists, by prolonging rest intervals without affecting the properties of swim episodes (duration; frequency; extent of depolarization) either behaviorally or during fictive swimming. Furthermore, bumetanide and 5HT antagonists suppressed the amplitude of depolarizing responses evoked by ionophoresis of glycine onto spinal neurons in the presence of tetrodotoxin and transiently suppressed the amplitude of responses to glycine measured after fictive swimming. The effects of bumetanide contrasted with and occluded the effects of 5HT. We suggest that, during development, endogenous 5HT modulates chloride homeostasis during the quiescent intervals and thereby offsets the long periods of quiescence commonly observed in developing networks to allow expression of sustained and behaviorally relevant activity.


Figures

Figure 1.
Figure 1.
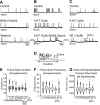
Effects of bumetanide (BUM), serotonergic antagonist methysergide (MT), 5HT, and vehicle on the spontaneous swimming pattern of 4-d-old larvae (behavioral experiments). A, Temporal distribution plots (300-s-long excerpts) of swim episodes (black diamonds) before (control, top) and 3 min after (bottom) bumetanide injection into the pericardial sac. Bumetanide fragmented the robust and consistent swimming pattern into clusters of activity by causing the appearance of long rest intervals lasting over 30 s. B, Temporal distribution plots (300-s-long excerpts) of swim episodes before (control, top) and 11 min after (bottom) methysergide injection. Methysergide, like bumetanide, reduced the number of swim episodes and caused the appearance of long rest intervals. C, Temporal distribution plots (60-s-long excerpts) of swim episodes before (control, top) and 3 min after (bottom) 5HT injection. 5HT, in contrast to bumetanide and methysergide, increased the number of swim episodes by reducing the duration of rest intervals. D, Temporal distribution plots (60-s-long excerpts) of swim episodes before (control, top) and 7 min after vehicle injection (bottom). Vehicle had no effect on the temporal distribution of spontaneous swimming of 4-d-old larvae. E, The box plot on the left (i) summarizes the distribution of swim episode durations across all experiments under different drug conditions: C (control), 5HT/Q (pooled data of 5HT and quipazine), MT (methysergide), BUM (bumetanide), and V (vehicle). All swim episode durations fell into the same range (for statistics, see Results). Event numbers are given in parentheses. The box plot on the right (ii) summarizes the distribution of rest intervals across all experiments. The data show that methysergide and bumetanide caused the appearance of long rest intervals (see outlying symbols), whereas 5HT decreased them significantly (for statistics, see Results). F, Bar graphs summarizing the effects of the different drugs on the number of swim episodes (percentage of control) across all experiments. 5HT and quipazine doubled the number of swim episodes, whereas methysergide and bumetanide decreased it dramatically (5-30% of control) and vehicle had no effect. None of the drugs significantly affected the number of swim episodes of younger 3-d-old larvae (for statistics, see Results). Error bars indicate SD.
Figure 2.
Figure 2.
Effects of bumetanide (BUM), serotonergic antagonist methysergide (MT), and 5HT on the spontaneous neuronal fictive swimming (whole-cell recordings). A, Representative traces of fictive swimming activity recorded in motoneurons before (control, top), after bumetanide (center), and in washout condition (bottom). The peaks of the spikes have been truncated. Bumetanide (3 min) caused clustering of fictive swim episodes that were separated by long quiescent intervals. This effect was reversible (washout). The asterisks point to expanded segments in D. B, 5HT (center) (Fig. 2C, center) reduced the duration of rest intervals compared with control (top). This effect was blocked by bumetanide (2 min), even in the presence of 5HT (bottom). C, Methysergide (bottom), similar to bumetanide, fragmented the robust fictive swimming induced by 5HT (center). D, Two superimposed fictive swim episodes, before (black line) and after bumetanide (gray line), taken from A (indicated by asterisk) to illustrate the similarity in their properties (duration, frequency, and area; illustrated by gray shade). These are summarized across all experiments in E-G. E, Box plots illustrating that the duration of fictive swim episodes across all experiments [before (C) and after 5HT, methysergide, bumetanide, 5HT plus bumetanide, and washout (W)] was conserved. F, The fictive swimming frequency (calculated from the large EPSPs, three of which are indicated by arrows in D; EPSPs could sometimes carry spikes) was similar across all experimental conditions as illustrated by box plots. G, The extent of depolarization during fictive swim episodes, calculated from the area under the curve (D, gray shade), was the same across all experiments, despite the pronounced effects of the drugs on the swim pattern. Error bars indicate SD.
Figure 3.
Figure 3.
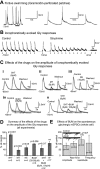
Effects of bumetanide (BUM), serotonergic antagonist methysergide (MT), ketanserin (KE), and 5HT on isolated ionophoretically evoked glycine (Gly) responses (perforated-patch recordings). A, Spontaneous fictive swimming (left trace) was recorded from spinal neurons using gramicidin-perforated patches (the spikes have been truncated). The depolarizing fictive swim episodes (right, expanded traces taken from the boxed segment on the left) resembled those observed with whole-cell recordings (Fig. 2). B, Depolarizing glycine responses, evoked ionophoretically (see Materials and Methods), had constant amplitudes (control, left) and were blocked by strychnine (right). C, Effects of 5HT (i), methysergide (MT) (ii), ketanserin (KE) (iii), bumetanide (BUM) (iv), and 5HT plus bumetanide (5HT plus BUM) (v) on the amplitude of ionophoretically evoked glycine responses. Each example illustrates an averaged glycine response (heavy line) with its interval of confidence (99%, dashed line) in control, after drug, and washout recordings. 5HT (4 min) increased the amplitude of the glycine-evoked responses by 51%, whereas methysergide (2.5 min), ketanserin (4 min), and 5HT plus bumetanide (13 min) decreased it (24-54% of control). Bumetanide (35-50 μm; 3 min) also significantly reduced the amplitude of the glycine-evoked responses (80% of control). These effects were reversible (see washout in each experimental set). D, The effects of the different drugs on the amplitude of glycine-evoked responses across experiments are summarized in the bar graphs. E, Bumetanide (BUM) had no effect on the properties of spontaneous glycinergic mPSCs, as summarized in the bar graphs. The inset superimposes several glycinergic mPSCs (whole-cell voltage-clamp recordings). Error bars indicate SD.
Figure 4.
Figure 4.
Effects of 5HT methysergide and bumetanide on ionophoretically evoked glycine (Gly) responses during spontaneous fictive swimming (perforated-patch recordings). A-F, Temporal distribution plots of the amplitude of glycine-evoked responses (black symbols) during fictive spontaneous swimming. Swim episodes are illustrated by gray boxes. The plots were reconstructed from raw data as illustrated in the inset in A. During the rest interval, after swimming, the amplitude of the glycine-evoked responses was relatively constant in the control (A, C) and after 5HT (B, E, dashed line). However, after methysergide (D) or 5HT plus bumetanide (F) treatment, the amplitude of the first glycine-evoked response (white symbol) was low after bouts of swimming and gradually recovered during the rest interval (dashed line). G, Bargraphs illustrating the recovery ratio (percentage); the ratio between the amplitude of the first glycine response (first white symbol) in the rest interval and that of the last one in the rest interval (last white symbol) across all experiments under the different experimental conditions, control (C), 5HT, methysergide (MT), and 5HT plus bumetanide (5HT plus BUM). This recovery ratio decreased to ∼80% under methysergide and 5HT plus bumetanide but was constant (∼100%) in the presence of 5HT or in the control (for statistics, see Results). Error bars indicate SD.

References

    1. Ali DW, Drapeau P, Legendre P (2000) Development of spontaneous glycinergic currents in the Mauthner neuron of the zebrafish embryo. J Neurophysiol 84: 1726-1736. - PubMed
    1. Ben-Ari Y (2001) Developing networks play a similar melody. Trends Neurosci 24: 353-360. - PubMed
    1. Branchereau P, Morin D, Bonnot A, Ballion B, Chapron J, Viala D (2000) Development of lumbar rhythmic networks: from embryonic to neonate locomotor-like patterns in the mouse. Brain Res Bull 53: 711-718. - PubMed
    1. Brustein E, Marandi N, Kovalchuk Y, Drapeau P, Konnerth A (2003a) “In vivo” monitoring of neuronal network activity in zebrafish by two-photon Ca2+ imaging. Pflügers Arch 446: 766-773. - PubMed
    1. Brustein E, Chong M, Holmqvist B, Drapeau P (2003b) Serotonin patterns locomotor network activity in the developing zebrafish by modulating quiescent periods. J Neurobiol 57: 303-322. - PubMed

Publication types

LinkOut - more resources