. 2005 Nov 16;25(46):10786-95.
doi: 10.1523/JNEUROSCI.3508-05.2005.

Signal propagation and logic gating in networks of integrate-and-fire neurons

Affiliations

Signal propagation and logic gating in networks of integrate-and-fire neurons

Tim P Vogels et al. J Neurosci. .

Abstract

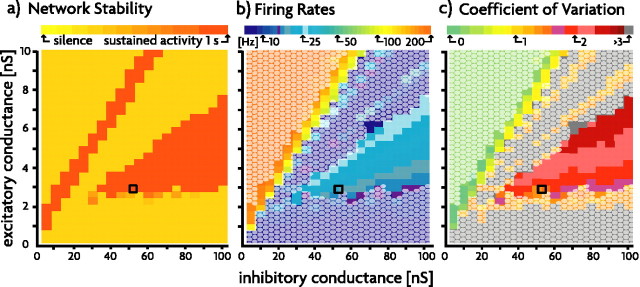
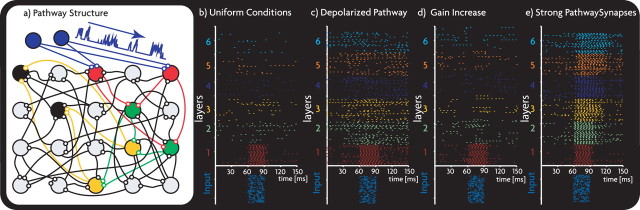
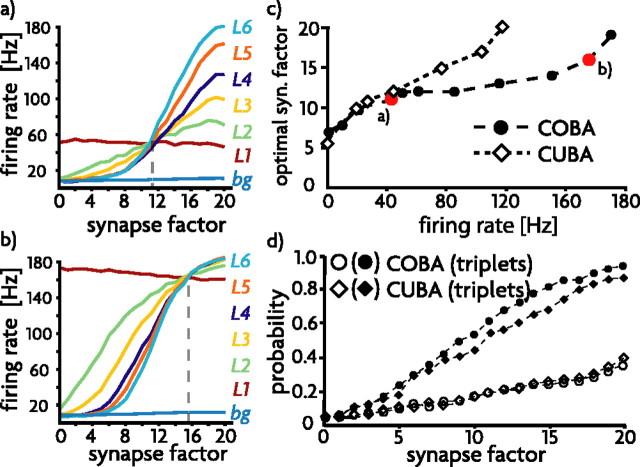
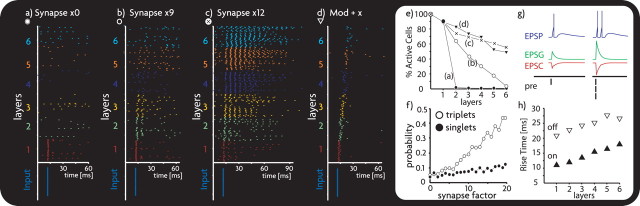
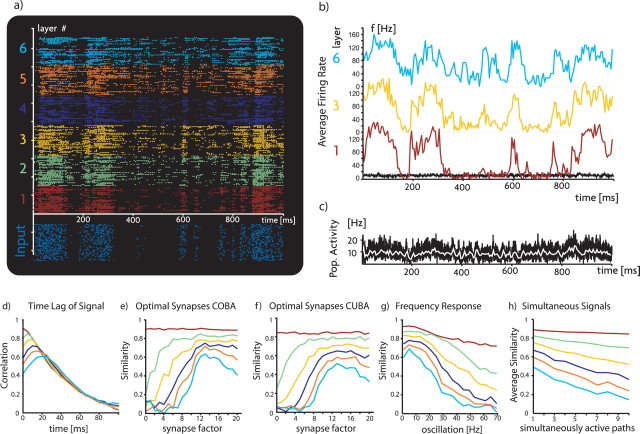
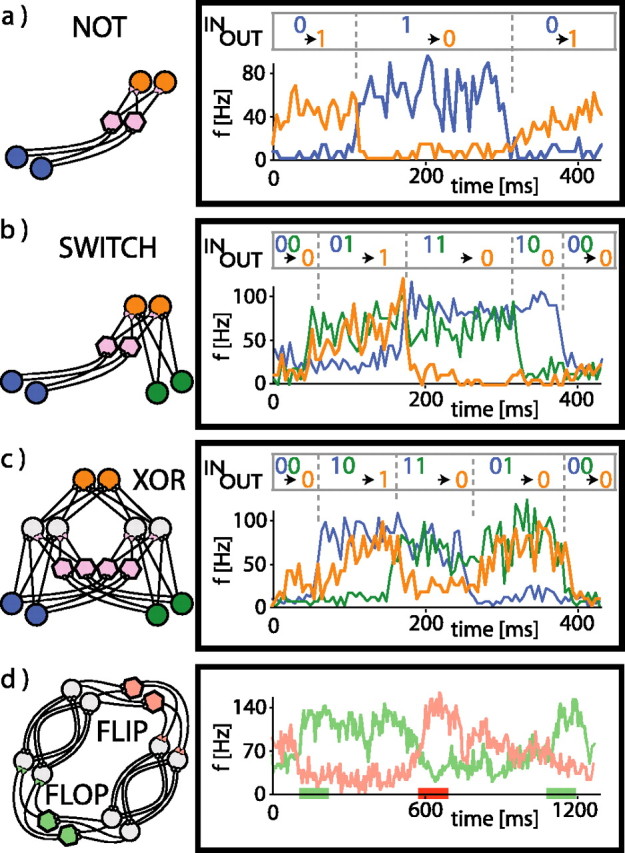
Transmission of signals within the brain is essential for cognitive function, but it is not clear how neural circuits support reliable and accurate signal propagation over a sufficiently large dynamic range. Two modes of propagation have been studied: synfire chains, in which synchronous activity travels through feedforward layers of a neuronal network, and the propagation of fluctuations in firing rate across these layers. In both cases, a sufficient amount of noise, which was added to previous models from an external source, had to be included to support stable propagation. Sparse, randomly connected networks of spiking model neurons can generate chaotic patterns of activity. We investigate whether this activity, which is a more realistic noise source, is sufficient to allow for signal transmission. We find that, for rate-coded signals but not for synfire chains, such networks support robust and accurate signal reproduction through up to six layers if appropriate adjustments are made in synaptic strengths. We investigate the factors affecting transmission and show that multiple signals can propagate simultaneously along different pathways. Using this feature, we show how different types of logic gates can arise within the architecture of the random network through the strengthening of specific synapses.


Figures

Figure 1.
Figure 1.
Parameter search. Excitatory and inhibitory conductances refer to the parameters Δgex and Δginh converted to nanosiemens assuming a resting neuronal membrane conductance of 100 MΩ. The black square shows the parameter values used in all subsequent COBA simulations. a, Duration of network activity. Parameter pairs in which network activity was sustained over the length of the simulation (1000 ms) are colored in orange. Pairs leading to silent networks are shown in yellow and the same regions are denoted by a white mesh in b and c. b, Average network firing rates. Firing rates in configurations with sustained activity range from 8 to 200 Hz. c, Average CV of ISIs. CVs range from 0 (very regular) to 3 (very bursty) over the range in which activity was sustained.
Figure 2.
Figure 2.
Background activity in a COBA model. a, Spike raster for a sample set of 250 neurons over a simulated time of 400 ms. b, Average firing rate of the entire population and of a Poisson train. The black trace shows the rate computed from 0.1 ms bins, and the white trace shows the same activity computed using 5 ms bins. The top panel is computed from the network, and the bottom panel, for comparison, from an equivalent number of Poisson processes with a 5 ms refractory period producing spikes at the same rate as the network. c, Membrane currents of a randomly chosen neuron. Inhibitory currents are in dark gray, excitatory ones are in light gray, and the total synaptic current is shown in solid black. d, Membrane potential of a randomly chosen neuron. e, Distribution of firing rates of the network neurons. f, Distribution of ISIs of the network neurons. g, Distribution of CVs of ISIs of the network neurons. h, Distribution of average membrane potentials of the network neurons. e-h, The arrow marks the mean of the distribution. Pop., Population; Pot., potential.
Figure 3.
Figure 3.
Differences in the background activity of the CUBA (a) and COBA (b) models. Distribution of ISIs in each model plotted on a semilog scale is shown (left). The arrow marks the mean of each distribution. Membrane potentials of a randomly chosen neuron in each model are shown (right). Note that the two models are operating in different parameter regimes (see Results).
Figure 4.
Figure 4.
Signal propagation. a, Network diagram showing the layers of a candidate pathway. Input (blue) is fed into the network through strong synapses onto layer 1 neurons (red). In this and the following diagrams, layers 1-6 are indicated by the colors green, yellow, dark blue, orange, and light blue, respectively. The gray-filled circles denote nonpathway neurons of the network. For this figure, layer 0 activity consists of a 30 ms pulse of activity at ∼180 Hz. b, In a network with uniform excitatory and inhibitory synaptic strengths and neuronal parameters, no propagation occurs. c, Depolarization of pathway neurons by 15 mV fails to induce propagation, although firing rates in all affected cells increase. d, Gain increase of pathway neurons. Because gain modulation maintains the excitatory/inhibitory balance, firing rates do not increase significantly, but activity fails to propagate. e, Strengthening of pathway synapses by ∼10-fold results in signal propagation.
Figure 5.
Figure 5.
Optimal synaptic enhancement. a, b, Average firing rates of layer 1 (red), 2 (green), 3 (yellow), 4 (dark blue), 5 (orange), and 6 (light blue) in response to a constant layer 0 rate of 50 Hz (a) or 170 Hz (b). The background rate of nonpathway neurons is indicated by the straight black line at the bottom. The ratio of the strength of pathway synapses to nonpathway synapses is 1 plus the synapse factor. The optimal synapse enhancement factor is indicated by the vertical dashed line. c, The optimal synapse enhancement factors in COBA and CUBA models for different layer 0 firing rates. The examples shown in a and b are filled in red. d, The probability of a postsynaptic spike within a 5 ms window of a presynaptic single spike (open symbol) or a synchronous triplet of presynaptic spikes (solid symbols), plotted as a function of the synapse factor for both COBA and CUBA models.
Figure 6.
Figure 6.
A study of synfire waves in response to a synchronous signal fed into layer 1. a, No propagation occurs in the unaltered network. b, For synapse factor 9, the signal propagates up to layer 3 but then gets washed out by spontaneous activity. c, For synapse factor 12, the signal evokes a response in all layers, but packet length increases with every layer because of secondary spiking. d, When the pathway neurons are gain modulated to decrease their responsiveness by 10-fold and the synapse factor is 30, the difference between pathway and nonpathway synapses can be increased enough to propagate a synfire wave through six layers. Mod + x, Gain modulated and synapses strengthened. e, Average number of active cells in the first propagated wave front of a synfire event, plotted for the different cases described in a-d. f, Probability of evoking a secondary spike within 5 ms of the end of the refractory period of the first spike, plotted for presynaptic singlets (solid) and triplets (open). Each point is calculated from 5000 stimuli delivered to randomly chosen neurons. g, Secondary spikes are evoked when the postsynaptic conductance is large. h, Rise-time delays for on (solid) and off (open) signals consisting of pulses between 0 and 100 Hz at synapse factor 12. Higher layers have slower rise times, because they are affected by the rise times of their precursors as well.
Figure 7.
Figure 7.
Transmission of time-varying signals in a COBA network. a, Raster of the propagation of a randomly varying layer 0 firing rate through all six layers. b, Average firing rates, calculated in 5 ms bins, for layers 1, 3, and 6 responding to a randomly varying layer 0 rate. c, Average network firing rates (black trace, 0.1 ms bins; white trace, 5 ms bins) are relatively unaffected by the propagating fluctuations. d, Correlations of layer 1 (red), 2 (green), 3 (yellow), 4 (dark blue), 5 (orange), and 6 (light blue) firing rates with the layer 0 rate computed at various time delays. e, Similarity values of layer 1-6 firing rates with the layer 0 rate as a function of the synaptic enhancement factor in the COBA model. Optimal transmission occurs at a synapse factor of 12, corresponding to a 13-fold increase in synaptic strength. f, Same as e, but for the CUBA model. g, Similarity values for layer 0 rates oscillating sinusoidally at different frequencies. h, Similarity values when different numbers of signals propagate through the network along 10 different pathways.
Figure 8.
Figure 8.
Processing units constructed by synaptically tuning existing network subcircuits. a, NOT gate. b, Switch. c, XOR gate. d, Flip-flop. The left side of each subplot shows the layout of each circuit, with inhibitory neurons drawn as hexagons. On the right, the average firing rates of input and output layers are plotted along with the Boolean interpretation above the traces. In d, external input to the different loops is indicated by color-coded bars along the x-axis.

References

    1. Abeles M (1991) Corticonics: neural circuits of the cerebral cortex. Cambridge, UK: Cambridge UP.
    1. Aertsen A, Diesmann M, Gewaltig MO (1996) Propagation of synchronous spiking activity in feedforward neural networks. J Physiol (Paris) 90: 243-247. - PubMed
    1. Amit DJ, Brunel N (1997) Model of global spontaneous activity and local structured activity during delay periods in the cerebral cortex. Cereb Cortex 7: 237-252. - PubMed
    1. Anderson JS, Lampl I, Gillespie DC, Ferster D (2000) The contribution of noise to contrast invariance of orientation tuning in cat visual cortex. Science 290: 1968-1972. - PubMed
    1. Aviel Y, Mehring C, Abeles M, Horn D (2003) On embedding synfire chains in a balanced network. Neural Comput 15: 1321-1340. - PubMed

Publication types

LinkOut - more resources