Comparative Study
. 2005 Nov 16;25(46):10796-802.
doi: 10.1523/JNEUROSCI.1637-05.2005.

Neural correlates of fine depth discrimination in monkey inferior temporal cortex

Affiliations
Comparative Study

Neural correlates of fine depth discrimination in monkey inferior temporal cortex

Takanori Uka et al. J Neurosci. .

Abstract

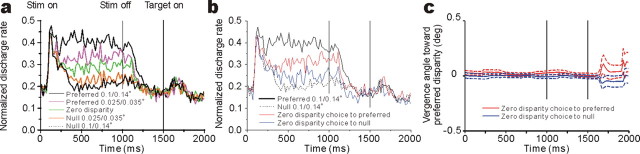
Binocular disparity is an important visual cue that gives rise to the perception of depth. Disparity signals are widely spread across the visual cortex, but their relative role is poorly understood. Here, we addressed the correlation between the responses of disparity-selective neurons in the occipitotemporal (ventral) visual pathway and the behavioral discrimination of stereoscopic depth. We recorded activity of disparity-selective neurons in the inferior temporal cortex (IT) while monkeys were engaged in a fine stereoscopic depth discrimination (stereoacuity) task. We found that trial-to-trial fluctuations in neuronal responses correlated with the monkey's perceptual choice. We suggest that disparity signals in the IT, located in the ventral visual pathway, are functionally linked to the discrimination of fine-grain depth.


Figures

Figure 1.
Figure 1.
Visual stimulus and the stereoacuity task. a, In each experiment, one of nine shapes that elicited the best response at zero-disparity was used in the task. Scale bar, 3°. b, The task schedule. The dotted square shows the fixation window, which was not actually visible. Monkeys were trained to make a leftward saccade for uncrossed (far) disparities and a rightward saccade for crossed (near) disparities. c, Behavioral performance from both monkeys. The proportion of far choices is plotted as a function of horizontal disparity. In addition to binocular (•) presentations, monocular (▵, left eye; ▿, right eye) presentations were tested. deg, Degree. d, Histological reconstruction of the recording site in monkey 1. Monkey 2 was still used in a different experiment, but the recording chamber was placed in a similar position. st, Superior temporal sulcus; amt, anterior middle temporal sulcus.
Figure 2.
Figure 2.
Example disparity tuning and the relationship between neuronal responses and the monkey's choice. a, Discharge rate (mean ± SEM) of 10 presentations is plotted as a function of horizontal disparity. Data points are connected using a spline fit. deg, Degree. b, Trial-to-trial responses and the monkey's subsequent choices (•, near choice; ○, far choice) are plotted for zero-disparity trials. c, Response magnitude histograms for near (▪) and far (□) choice trials are superimposed for seven disparities (shown on the right). The choice probabilities calculated for each disparity (shown on the left) were 0.55-0.70.
Figure 3.
Figure 3.
Choice probabilities do not depend on visual stimulus parameters. a, The average choice probability across 57 neurons is plotted as a function of signed binocular disparity (positive and negative values correspond to stimuli at the preferred and null disparities, respectively). Disparity levels at which the monkey made choices to one target >75% of the time were excluded from the analysis. Error bars indicate SDs. Points with no error bars indicate those calculated from one data. deg, Degree. b, Choice probabilities calculated from responses to the preferred disparity are plotted against those for the null disparity. Responses of each neuron to each disparity were normalized using z scores (subtracting the mean response and dividing by the SD), and the normalized responses were then combined across preferred and null disparities separately to compute choice probabilities. Disparity levels at which the monkey made choices to one target >75% of the time, as well as zero-disparity trials, were excluded from the analysis. There is one datum for each of 55 neurons. Two cells were discarded because no disparity levels passed the criteria described above for either the preferred or null disparity.
Figure 4.
Figure 4.
The dependence of vergence angle on choice probabilities. a, Vergence-corrected choice probabilities are plotted against original grand choice probabilities (n = 57). Frequency histograms for each dimension are plotted on the top and right. Filled bars represent cells with choice probabilities significantly different from 0.5 (permutation test; p < 0.05). b, Grand choice probabilities calculated from vergence angles are plotted against those calculated from neuronal responses. CP, Choice probability.
Figure 5.
Figure 5.
Time course of IT responses. Responses were binned into 20 ms bins and averaged across trial repetitions. For each neuron, responses for all disparities were then normalized to the peak-firing bin. Normalized firing rates were then averaged across the 28 neurons with choice probabilities significantly greater than 0.5. a, Mean normalized poststimulus time histograms (PSTHs) are shown for five different disparities. All trials at each disparity were included regardless of the monkey's choice. Stim, Stimulus. b, Mean normalized PSTHs are shown separately for preferred (red) and null (blue) choices at zero disparity. PSTHs for large disparities (solid trace, preferred; dashed trace, null) are shown as well.c, Time course of vergence angle sorted by choice (red, preferred; blue, null) for zero-disparity trials. The sign of vergence was corrected for each neuron so that positive values indicate convergence for near neurons and divergence for far neurons. Error bars indicate SEMs across the 28 neurons. deg, Degree.

References

    1. Bradley DC, Chang GC, Andersen RA (1998) Encoding of three-dimensional structure-from-motion by primate area MT neurons. Nature 392: 714-717. - PubMed
    1. Britten KH, Newsome WT, Shadlen MN, Celebrini S, Movshon JA (1996) A relationship between behavioral choice and the visual responses of neurons in macaque MT. Vis Neurosci 13: 87-100. - PubMed
    1. Burkhalter A, Van Essen DC (1986) Processing of color, form and disparity information in visual areas VP and V2 of ventral extrastriate cortex in the macaque monkey. J Neurosci 6: 2327-2351. - PMC - PubMed
    1. DeAngelis GC, Uka T (2003) Coding of horizontal disparity and velocity by MT neurons in the alert macaque. J Neurophysiol 89: 1094-1111. - PubMed
    1. DeAngelis GC, Cumming BG, Newsome WT (1998) Cortical area MT and the perception of stereoscopic depth. Nature 394: 677-680. - PubMed

Publication types

LinkOut - more resources