. 2005 Dec 7;24(23):4176-87.
doi: 10.1038/sj.emboj.7600879. Epub 2005 Nov 17.

The regulation of mDia1 by autoinhibition and its release by Rho*GTP

Affiliations

The regulation of mDia1 by autoinhibition and its release by Rho*GTP

Michael Lammers et al. EMBO J. .

Abstract

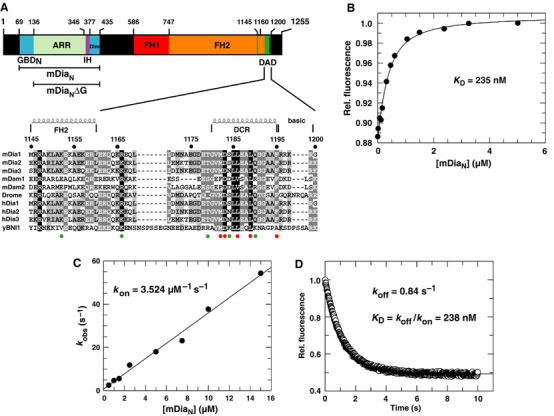
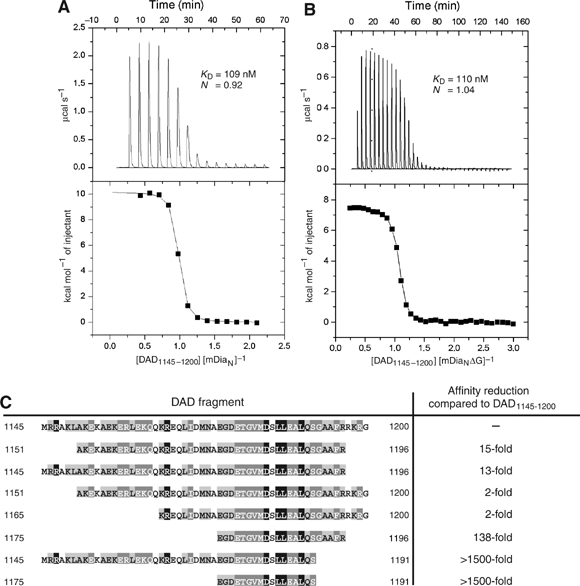
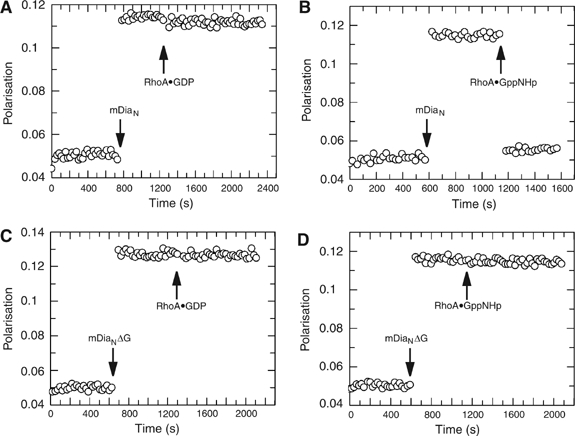
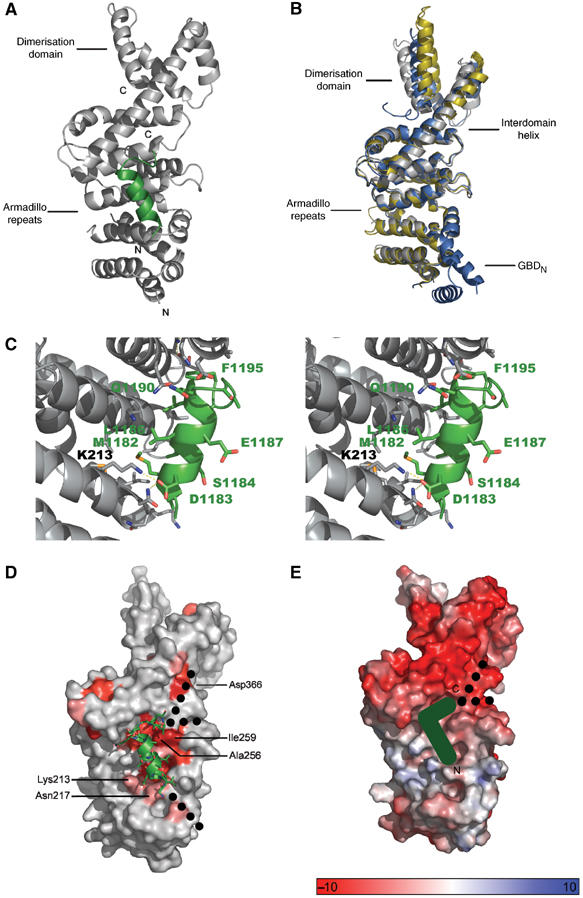
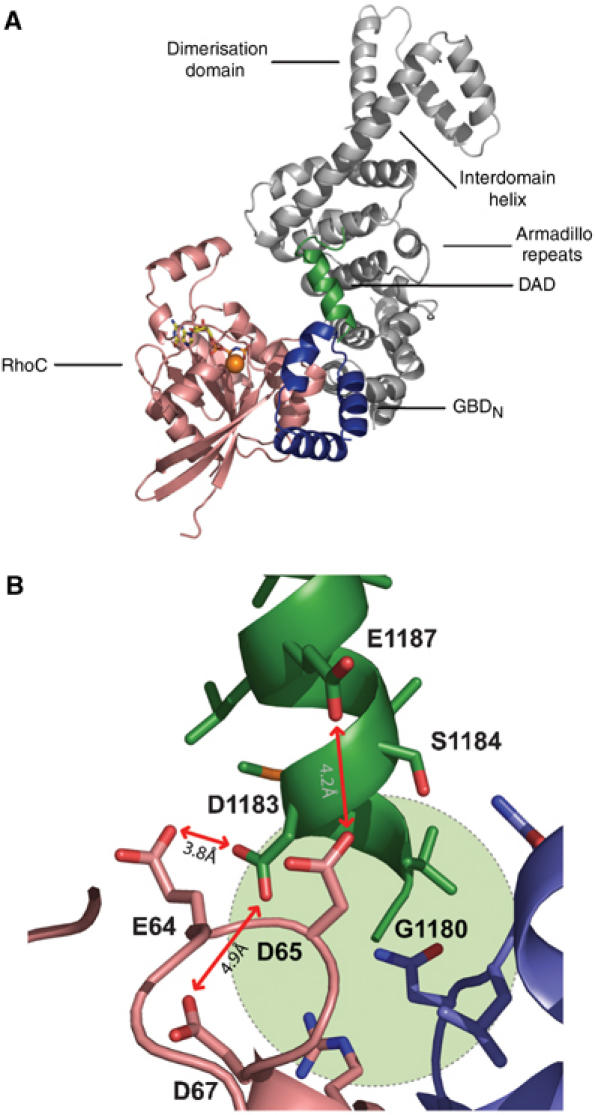
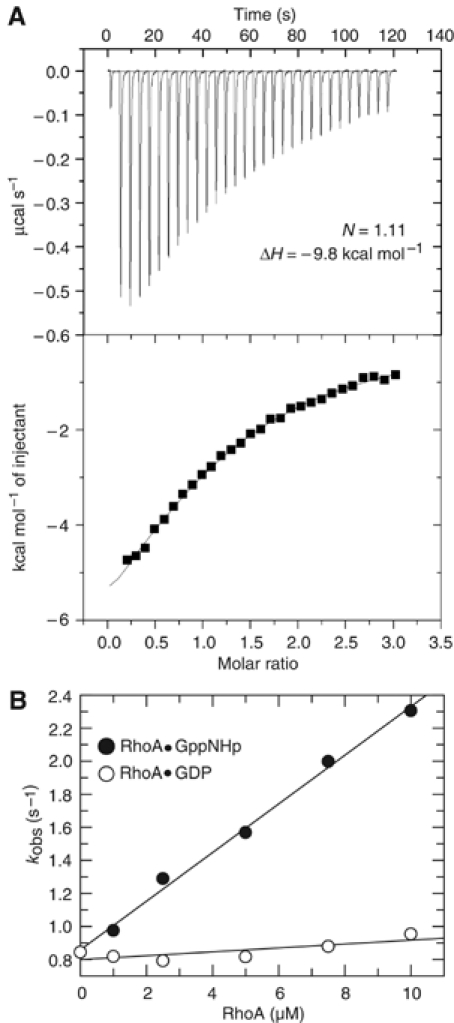
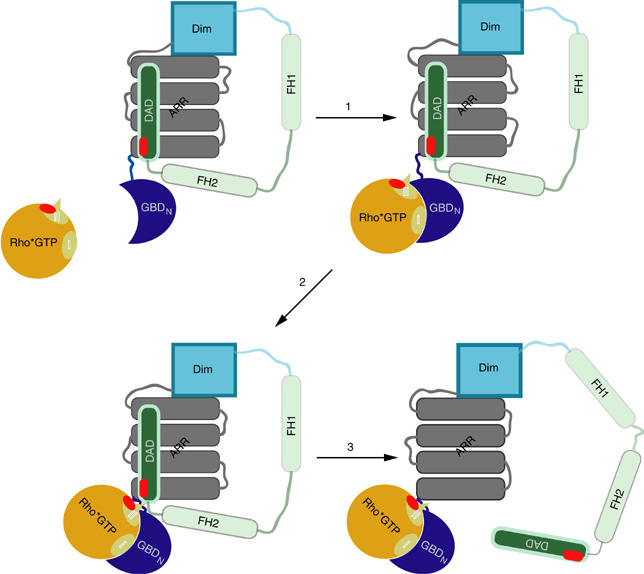
Formins induce the nucleation and polymerisation of unbranched actin filaments via the formin-homology domains 1 and 2. Diaphanous-related formins (Drfs) are regulated by a RhoGTPase-binding domain situated in the amino-terminal (N-terminal) region and a carboxy-terminal Diaphanous-autoregulatory domain (DAD), whose interaction stabilises an autoinhibited inactive conformation. Binding of active Rho releases DAD and activates the catalytic activity of mDia. Here, we report on the interaction of DAD with the regulatory N-terminus of mDia1 (mDia(N)) and its release by Rho*GTP. We have defined the elements required for tight binding and solved the three-dimensional structure of a complex between an mDia(N) construct and DAD by X-ray crystallography. The core DAD region is an alpha-helical peptide, which binds in the most highly conserved region of mDia(N) using mainly hydrophobic interactions. The structure suggests a two-step mechanism for release of autoinhibition whereby Rho*GTP, although having a partially nonoverlapping binding site, displaces DAD by ionic repulsion and steric clashes. We show that Rho*GTP accelerates the dissociation of DAD from the mDia(N)*DAD complex.


Figures

Figure 1
Figure 1
N- and C-terminal constructs of mDia1 and their interaction. (A) Schematic representation of the domain structure of mDia1 and the constructs used. mDiaN, the regulatory region; GBDN, GTPase-binding domain; mDiaNΔG, the regulatory region minus GBDN; ARR, armadillo-repeat region; IH, interdomain helix; Dim, dimerisation domain; FH1-2, formin-homology domains 1, 2; DAD, Diaphanous-autoregulatory domain. Shown below is an alignment of the DAD1145−1200 fragment from different genes and organisms (accession numbers in brackets): mDia1–3: mouse (O08808; Q9Z207; O70566); mDam1–2: mouse (Q8BPM0; Q80U19); Dia: Drosophila (P48608); hDia1–3, human (O60610; O60879; Q9NSV4); yBNI1, Saccharomyces cerevisiae (P41832). Black shaded residues are conserved in 100%, dark grey shaded in 80% and bright grey shaded in 60% of the depicted organisms at the specific position. Furthermore, residues with similar physiochemical properties are combined into groups. Residues 1145–1160 might belong to the FH2 domain and have a helical structure as shown previously (Shimada et al, 2004); the structure of the DCR (residues 1180–1195) was determined here. The red and green circles below the alignment represent residues whose mutations do or do not influence affinity towards mDiaN, respectively. (B) Determination of affinity between F-DAD1145−1200 and mDiaN using fluorescence. F-DAD1145−1200 (100 nM) was titrated with increasing concentration of mDiaN and the change in fluorescence obtained is plotted against the concentration of mDiaN. The data were fitted to a quadratic binding equation. (C) Association kinetics of F-DAD1145−1200 and mDiaN as determined by stopped flow. F-DAD is reacted with increasing concentrations of mDiaN and the observed first-order rate constants (kobs) are plotted against the mDiaN concentration. The slope of the linear fit represents kon. (D) The dissociation rate constant koff is determined by incubating 100 nM of a preformed F-DAD•mDiaN complex in the presence of a large excess of unlabelled DAD peptide. The fluorescence transient is fitted to a single-exponential decay.
Figure 2
Figure 2
ITC analysis of the DAD–mDiaN interaction. ITC of the interaction between DAD1145−1200 and either mDiaN (A) or mDiaNΔG (B), measured by titrating 40 μM/30 μM mDiaN/mDiaNΔG in the chamber with 940 μM/400 μM DAD1145−1200 in the syringe. Top panels, raw heating power over time; bottom panels, fit of the integrated energy values normalised for injected protein. (C) Result of affinity analysis of different DAD fragments for mDiaN, measured by ITC as in (A, B) and indicated as affinity reduction relative to the ‘full-length' DAD1145−1200 fragment.
Figure 3
Figure 3
Fluorescence polarisation assay to analyse competitive binding of RhoA or DAD towards mDiaN and mDiaNΔG, respectively. Fluorescently (AMCA)-labelled A-DAD peptide (residues 1175–1196) is incubated with either mDiaN (A, B) or mDiaNΔG (C, D) and leads to increase of the polarisation signal due to the decreased mobility of A-DAD upon complex formation. RhoA•GppNHp (B, D) and RhoA•GDP (A, C) are added as indicated.
Figure 4
Figure 4
Structure of the mDiaNΔG–DAD complex. (A) Ribbon diagram of the structure, where mDiaNΔG is grey and DAD green. Only residues 1180–1195, the DCR, are visible in the structure. (B) Superimposition of the mDiaNΔG from this structure (grey) and the structures of unbound (yellow) and Rho-bound (blue) mDiaN (Otomo et al, 2005b; Rose et al, 2005b), leaving out RhoC and GBDN. (C) Stereo view of the interface between the ARR and DAD, highlighting residues mentioned in the text. (D) Conservation of residues, where the intensity of red indicates the degree of conservation (accession numbers of compared proteins: mDia1 O08808, mDia2 Q9Z207; mDia3 O70566; hDia1 O60610; hDia2 O60879; DAAM1 human Q9Y4D1; DAAM1 mouse Q8BPM0; DAAM2 human Q86T65; DAAM2 mouse Q80U19; Gallus gallus Dia Q9DEH3; E. histolytica Dia Q514T8; DroMe Dia P48608); dashed lines show the possible paths of the N- and C-terminal extensions of the polypeptide chain; Asp366, Ile259, Ala256, Lys213 and Asn217 are highlighted. (E) Electrostatic potential of the mDiaNΔG surface as calculated with APBS (Baker et al, 2001), position of the DCR and the suspected polypeptide path from N to C as indicated.
Figure 5
Figure 5
Structural model for release of DAD by Rho binding. (A) Model of a complex of mDiaN with Rho•GTP and the DCR, using the previous RhoC complex structure (Rose et al, 2005b) and the DAD complex structure obtained here and the superimposition shown in Figure 4B. (B) Details of the electrostatic repulsion between DAD and Rho in a proposed ternary mDiaN–Rho–DAD complex; the steric clash on inserting the next DAD residue, Thr1179, is indicated by a green circle.
Figure 6
Figure 6
Effect of Rho binding on the mDiaN•DAD1145−1200 complex. (A) ITC analysis of the dissociation mDiaN–DAD1145−1200 complex (30 μM mDiaN; 60 μM DAD1145−1200) by titration with 400 μM RhoA•GppNHp, with upper and lower panels as in Figure 2A and B. (B) Dissociation of DAD from the mDiaN–DAD1145−1200 complex is followed by fluorescence as described in Figure 1D, in the presence of increasing amounts of RhoA•GppNHp (•) or RhoA•GDP (○). The dissociation rate constants kobs are plotted against the concentration of Rho.
Figure 7
Figure 7
Schematic two-step-binding model of DAD release from the regulatory region of mDia1 by Rho•GTP, as described in the text.

References

    1. Alberts AS (2001) Identification of a carboxyl-terminal Diaphanous-related formin homology protein autoregulatory domain. J Biol Chem 276: 2824–2830 - PubMed
    1. Baker NA, Sept D, Joseph S, Holst MJ, McCammon JA (2001) Electrostatics of nanosystems: application to microtubules and the ribosome. Proc Natl Acad Sci USA 98: 10037–10041 - PMC - PubMed
    1. Bedford MT, Chan DC, Leder P (1997) FBP WW domains and the Abl SH3 domain bind to a specific class of proline-rich ligands. EMBO J 16: 2376–2383 - PMC - PubMed
    1. Bishop AL, Hall A (2000) Rho GTPases and their effector proteins. Biochem J 348: 241–255 - PMC - PubMed
    1. Buck M, Xu W, Rosen MK (2004) A two-state allosteric model for autoinhibition rationalizes WASP signal integration and targeting. J Mol Biol 338: 271–285 - PubMed

Publication types

Associated data

LinkOut - more resources