

The Polycomb group gene Ezh2 prevents hematopoietic stem cell exhaustion
- PMID: 16293602
- PMCID: PMC1895717
- DOI: 10.1182/blood-2005-09-3585
The Polycomb group gene Ezh2 prevents hematopoietic stem cell exhaustion
Abstract
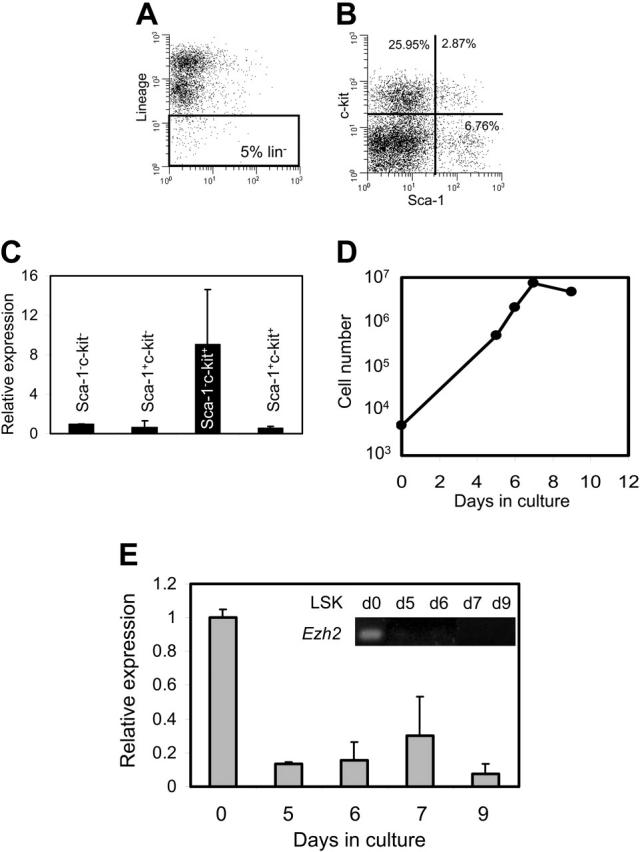
The molecular mechanism responsible for a decline of stem cell functioning after replicative stress remains unknown. We used mouse embryonic fibroblasts (MEFs) and hematopoietic stem cells (HSCs) to identify genes involved in the process of cellular aging. In proliferating and senescent MEFs one of the most differentially expressed transcripts was Enhancer of zeste homolog 2 (Ezh2), a Polycomb group protein (PcG) involved in histone methylation and deacetylation. Retroviral overexpression of Ezh2 in MEFs resulted in bypassing of the senescence program. More importantly, whereas normal HSCs were rapidly exhausted after serial transplantations, overexpression of Ezh2 completely conserved long-term repopulating potential. Animals that were reconstituted with 3 times serially transplanted control bone marrow cells all died due to hematopoietic failure. In contrast, similarly transplanted Ezh2-overexpressing stem cells restored stem cell quality to normal levels. In a "genetic genomics" screen, we identified novel putative Ezh2 target or partner stem cell genes that are associated with chromatin modification. Our data suggest that stabilization of the chromatin structure preserves HSC potential after replicative stress.
Figures
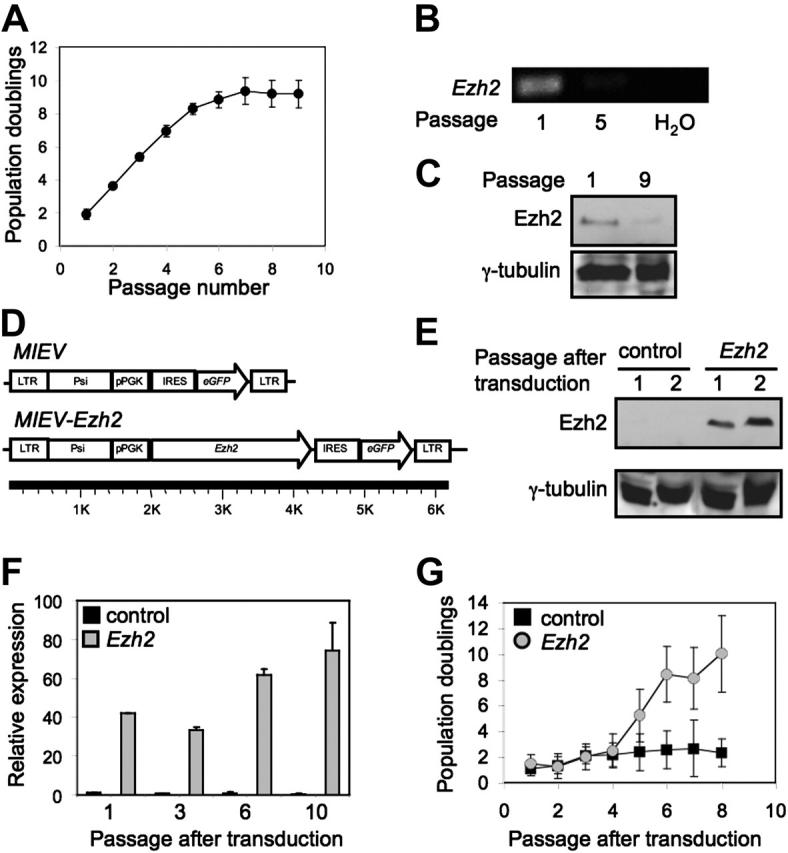
 ) at different passages after transduction. Expression levels of Ezh2 were determined by quantitative PCR and calculated relative to MEFs transduced with control at passage 1 after transduction. (G) Growth of MEFs after retroviral transduction (control, ▪; Ezh2,
  .
.
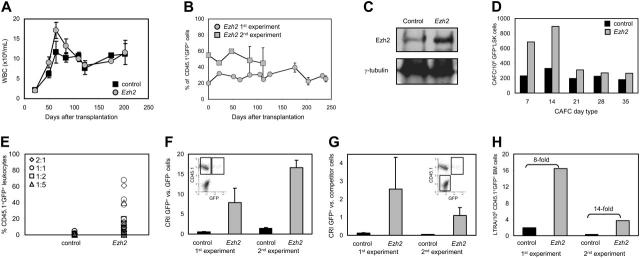 ) vectors (n = 11 recipients per group, 2 independent experiments). Mean values plus or minus standard error of the mean (SEM) are shown. (B) Chimerism at different time points after transplantation. The percentage of donor-derived transduced CD45.1+GFP+ WBCs is shown. Average values ± 1 SEM of 2 independent experiments are shown. (C) Ezh2 protein expression in the spleen about 120 days after primary transplantation of control or Ezh2 CD45.1 BM cells. (D) CAFC frequencies of sorted LSK GFP+ cells 120 days after primary transplantation (control, ▪; Ezh2, ). (E) Chimerism levels of secondary recipients, competitively transplanted with various ratios (2:1, ⋄; 1:1, ○; 1:2, □; 1:5, ▵) of transduced/nontransduced and freshly isolated BM cells, analyzed 3 months after transplantation. Values show data from individual recipients in 2 independent experiments (n = 35/group). (F) CRI calculated for CD45.1+GFP+ (transduced) versus CD45.1+GFP- (nontransduced) cells (see insert). Values (+ 1 SEM) are averages 3 months after secondary transplantation, based on 11 and 24 individual mice in the first and second experiment, respectively (control, ▪; Ezh2, ). (G) CRI calculated for transduced cells (CD45.1+GFP+) compared to freshly isolated BM cells (CD45.2+; see insert). Averages values (+ 1 SEM) of 11 and 24 individual mice of the first and second experiment, respectively, are shown (control, ▪; Ezh2, ). (H) LTRA frequencies in CD45.1+GFP+ (transduced) cell fractions calculated from limiting dilution analyses 3 months after secondary transplantation in 2 independent experiments (control, ▪; Ezh2, ).
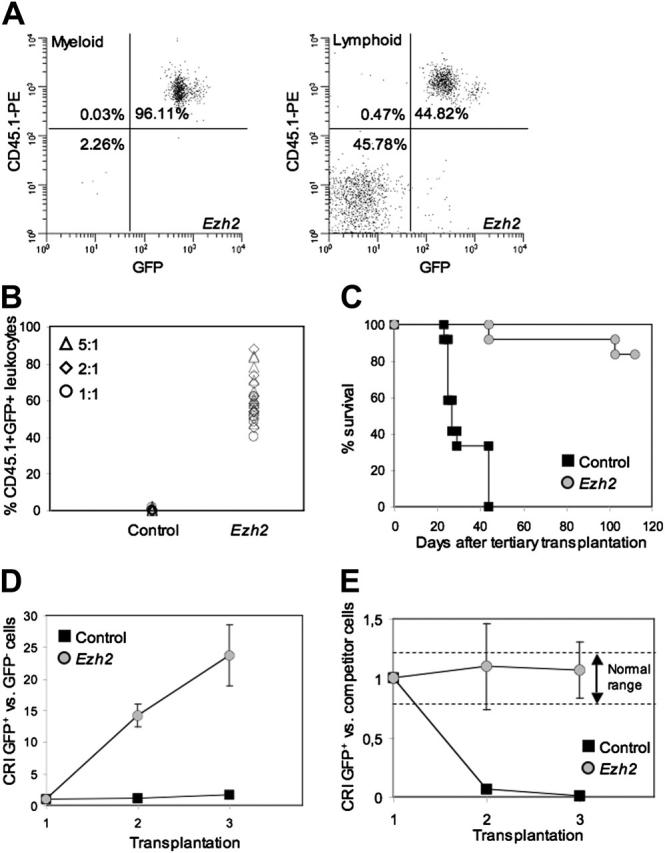 ). (D) CRI comparing transduced CD45.1+GFP+ stem cells versus nontransduced CD45.1+GFP- stem cells in primary, secondary, and tertiary recipients (control, ▪; Ezh2, ). (E) CRI comparing transduced CD45.1+GFP+ stem cells with freshly isolated BM cells after 1, 2, and 3 serial transplantations (control, ▪; Ezh2, ).
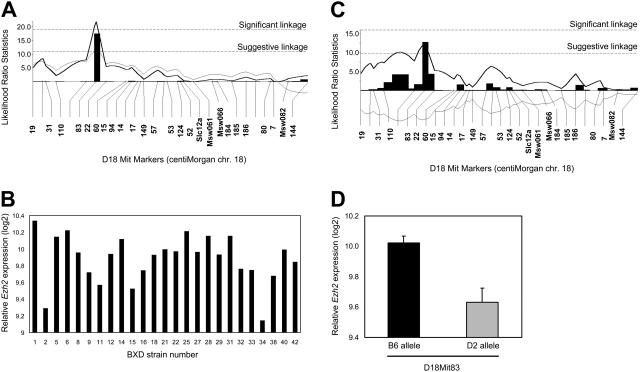 ) allele for marker D18Mit83.
References
-
- Mauch P, Hellman S. Loss of hematopoietic stem cell self-renewal after bone marrow transplantation. Blood. 1989;74: 872-875. - PubMed
-
- Nakauchi H, Sudo K, Ema H. Quantitative assessment of the stem cell self-renewal capacity. Ann N Y Acad Sci. 2001;938: 18-24. - PubMed
-
- Lund AH, van Lohuizen M. Polycomb complexes and silencing mechanisms. Curr Opin Cell Biol. 2004;16: 239-246. - PubMed
Publication types
MeSH terms
Substances
Grants and funding
LinkOut - more resources
Full Text Sources
Other Literature Sources
Medical
