Comparative Study
. 2005 Nov 29;102(48):17342-7.
doi: 10.1073/pnas.0506723102. Epub 2005 Nov 17.

3D structure of Alzheimer's amyloid-beta(1-42) fibrils

Affiliations
Comparative Study

3D structure of Alzheimer's amyloid-beta(1-42) fibrils

Thorsten Lührs et al. Proc Natl Acad Sci U S A. .

Abstract

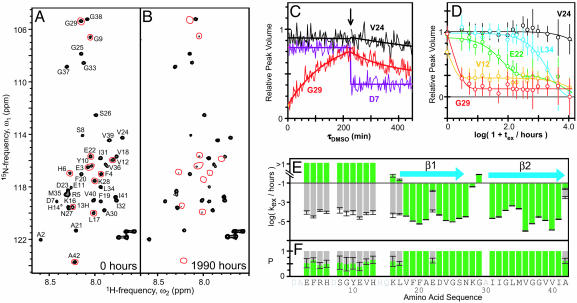
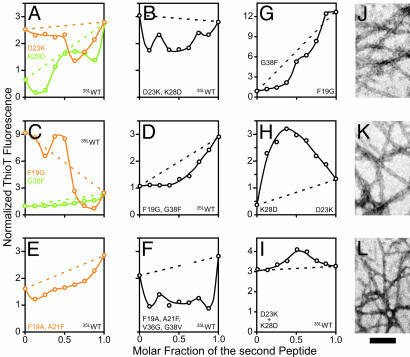
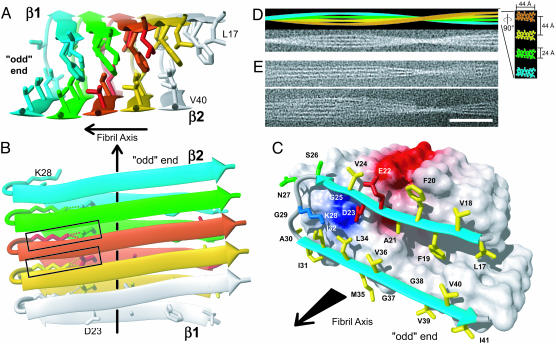
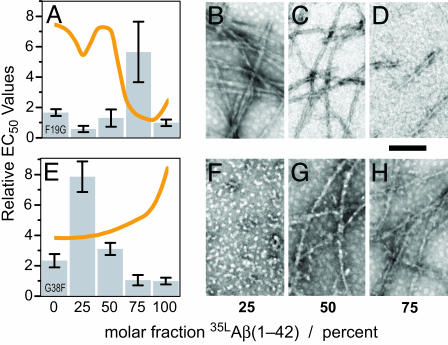
Alzheimer's disease is the most fatal neurodegenerative disorder wherein the process of amyloid-beta (Abeta) amyloidogenesis appears causative. Here, we present the 3D structure of the fibrils comprising Abeta(1-42), which was obtained by using hydrogen-bonding constraints from quenched hydrogen/deuterium-exchange NMR, side-chain packing constraints from pairwise mutagenesis studies, and parallel, in-register beta-sheet arrangement from previous solid-state NMR studies. Although residues 1-17 are disordered, residues 18-42 form a beta-strand-turn-beta-strand motif that contains two intermolecular, parallel, in-register beta-sheets that are formed by residues 18-26 (beta1) and 31-42 (beta2). At least two molecules of Abeta(1-42) are required to achieve the repeating structure of a protofilament. Intermolecular side-chain contacts are formed between the odd-numbered residues of strand beta1 of the nth molecule and the even-numbered residues of strand beta2 of the (n - 1)th molecule. This interaction pattern leads to partially unpaired beta-strands at the fibrillar ends, which explains the sequence selectivity, the cooperativity, and the apparent unidirectionality of Abeta fibril growth. It also provides a structural basis for fibrillization inhibitors.


Figures

Fig. 1.
Fig. 1.
Sequence-specific determination of regular secondary structure in 35MoxAβ(1–42) fibrils by quenched hydrogen exchange. (A and B) Fast heteronuclear multiple quantum correlation spectra of 15N-labeled monomeric 35MoxAβ(1–42) in d6-DMSO containing 0.01% d1-trifluoroacetic acid corresponding to fully protonated (A) and partially exchanged (B) amyloid fibrils. Sequence-specific chemical shift assignment of peptide backbone amide cross-peaks are indicated. Red lines encircle cross-peaks that show a virtually complete loss of intensity between exchange times tex = 0 and tex = 1,990 h. The shown spectra are a sum of the first 10 spectra recorded at the given tex.(C) Intrinsic exchange curves of 35MoxAβ(1–42) in DMSO. The evolution of the peak volumes versus the time (τDMSO) after dissociation of partially hydrogen-exchanged amyloid fibrils into monomers is shown. The identities are indicated next to each curve. The arrow indicates the time point at which a solution of 50% (mol/mol) D2OinH2O was added to yield a final combined deuteron/proton concentration of 2.0 mol·liter–1. Smooth, solid lines represent the monoexponential fits of the raw data. (D) Plot of peak volumes at τDMSO = 0 min versus logarithm of tex of 35MoxAβ(1–42) fibrils. Data for the residues V12 (yellow), E22 (green), V24 (black), G29 (red), and L34 (cyan) are shown. Smooth, solid lines represent fits of the data to a monoexponential equation (V24, L34, and G29) or to the sum of two monoexponential equations (V12 and E22). Error bars indicate the uncertainty in peak volume due to the noise level in each single measurement of initial peak volumes. (E and F) Plots of the observed exchange rates kex/h–1 (E) and the relative population P (F) against the amino acid sequence of 35MoxAβ(1–42). The blue arrows indicate β-strands.
Fig. 2.
Fig. 2.
Pairwise mutagenesis of 35LAβ(1–42) peptides. (A) Cartoon of intramolecular versus domain swapping-type interaction between monomers in the Aβ(1–42) protofilament that consists of parallel, in-register β-sheets exemplified by the salt bridge formed between the charged residues D23 and K28. Individual Aβ molecules are indicated as colored bars that correspond to a cross section along the protofilament axis through the Cα atom positions of one presumed interacting pair of amino acids. The identity of each variant Aβ peptide is indicated next to the corresponding schemes in rows 1–4. “intra” denotes the intramolecular scenario, and “inter” indicates the domain swapping-type scenario. Red diagonal crosses mark all scenarios that were considered to be incompatible with WT fibril formation. (BJ) Negative staining electron microscopy of 35LAβ(1–42) peptides. The variants are indicated on each image. All electron micrographs were recorded at a nominal magnification of ×72,000. (Scale bar, 100 nm.)
Fig. 3.
Fig. 3.
Phase behavior of binary 35LAβ(1–42) peptide mixtures. (AF) Plots of the normalized ThioT fluorescence against the mixing ratio with 35LAβ(1–42), as observed after 2 months of equilibration at room temperature. (GI) Plots of the normalized ThioT fluorescence against the mixing ratio of two variant Aβ peptides. In AI, the identities of the peptides present in the mixtures are indicated next to the corresponding y axis on each diagram. Plots corresponding to variants of the β1-strand are shown in orange, plots corresponding to variants of the β2-strand or its preceding loop are shown in green, and plots corresponding to double variants are shown in black. Dotted lines in the corresponding colors indicate the ThioT fluorescence that would be expected if the peptides in the mixture would not interact and thus aggregate independently of each other. The ThioT signal was normalized to the fluorescence signal of the single tyrosine in Aβ(1–42). (JL) Negatively stained electron micrographs corresponding to the samples at a molar fraction of 0.5 in GI, recorded at a nominal magnification of ×72,000. (Scale bar, 100 nm.)
Fig. 4.
Fig. 4.
The 3D structure of a 35MoxAβ(1–42) fibril. (A and B) Ribbon diagrams of the core structure of residues 17–42 illustrating the intermolecular nature of the inter-β-strand interactions. Individual molecules are colored. For example, the monomer at the odd end is shown in cyan. The β-strands are indicated by arrows, nonregular secondary structure is indicated by spline curves through the Cα atom coordinates of the corresponding residues, and the bonds of side chains that constitute the core of the protofilament are shown. In B, the intermolecular salt bridge between residues D23 and K28 is indicated by dotted lines, and the two salt bridges formed by the central Aβ(1–42) molecule are highlighted by rectangles. (C) van der Waals contact surface polarity and ribbon diagram at the odd end of the 35MoxAβ(1–42) protofilament comprising residues 17–42. The β-sheets are indicated by cyan arrows, and nonregular secondary structure is indicated by gray spline curves. The hydrophobic, polar, negatively charged, and positively charged amino acid side chains are shown in yellow, green, red, and blue, respectively. Positively and negatively charged surface patches are shown in blue and red, respectively, and all others are shown in white. The direction of the fibril axis is indicated by an arrow pointing from even to odd. (D)(Upper) Simulation of a 35MoxAβ(1–42) fibril that consists of four protofilaments colored individually. Lower shows the same fibril in a noisy gray-scale image, which has been blurred corresponding to a resolution of 2 nm. In Right,a ×5-magnified cross section perpendicular to the fibril axis is shown, using the same color code. Dimensions are indicated. To match the experimental twist of the protofilament of the fibril shown in E, a twist angle of 0.45° per molecule was used. (E) Two examples of cryoelectron micrographs of single 35MoxAβ(1–42) fibrils. (Scale bar, 50 nm.)
Fig. 5.
Fig. 5.
Morphology and neurotoxicity of Aβ(1–42) peptides. (A and E) Bar diagrams of the relative EC50 values of binary mixtures of F19G (A) and G38F (E) with 35LAβ(1–42) as obtained by the 3-(4,5-dimethylthiazol-2-yl)-2,5-diphenyl tetrazolium bromide assay using B12 cells. The orange lines indicate the relative ThioT fluorescence of the corresponding samples. (BD and FH) Negative stained electron micrographs of the individual peptide mixtures in A and E are shown to the right of the corresponding bar diagrams. The molar fraction of WT 35LAβ(1–42) is indicated below. (Scale bar, 100 nm.)

References

    1. Selkoe, D. J. (2003) Nature 426, 900–904. - PubMed
    1. Tycko, R. (2004) Curr. Opin. Struct. Biol. 14, 96–103. - PubMed
    1. Ritter, C., Maddelein, M. L., Siemer, A. B., Luhrs, T., Ernst, M., Meier, B. H., Saupe, S. J. & Riek, R. (2005) Nature 435, 844–848. - PMC - PubMed
    1. Nelson, R., Sawaya, M. R., Balbirnie, M., Madsen, A. O., Riekel, C., Grothe, R. & Eisenberg, D. (2005) Nature 435, 773–778. - PMC - PubMed
    1. Masters, C. L., Simms, G., Weinman, N. A., Multhaup, G., McDonald, B. L. & Beyreuther, K. (1985) Proc. Natl. Acad. Sci. USA 82, 4245–4249. - PMC - PubMed

Publication types

Associated data