. 2006 Feb 15;90(4):1175-90.
doi: 10.1529/biophysj.105.070904. Epub 2005 Nov 18.

Nucleic acid helix stability: effects of salt concentration, cation valence and size, and chain length

Affiliations

Nucleic acid helix stability: effects of salt concentration, cation valence and size, and chain length

Zhi-Jie Tan et al. Biophys J. .

Abstract

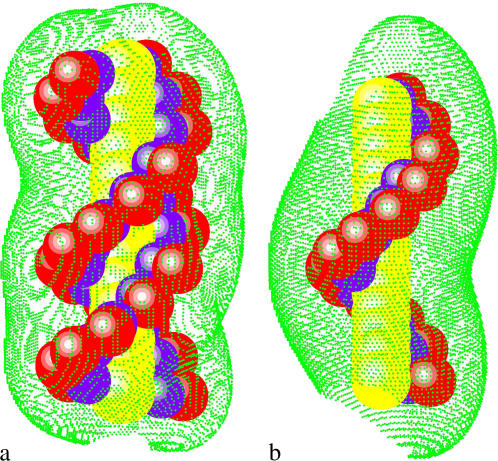
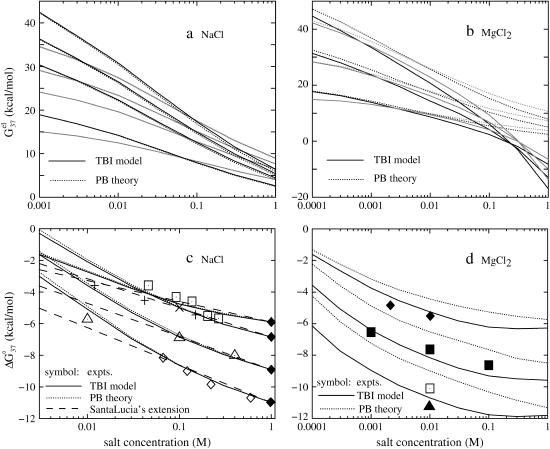
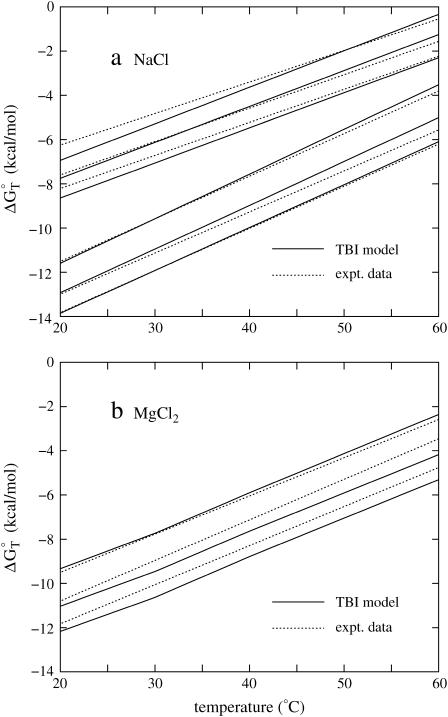
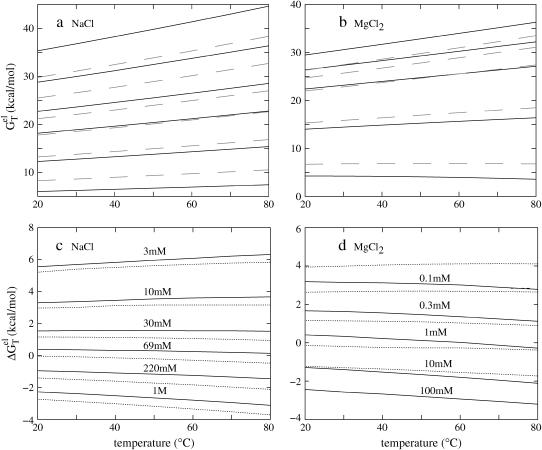
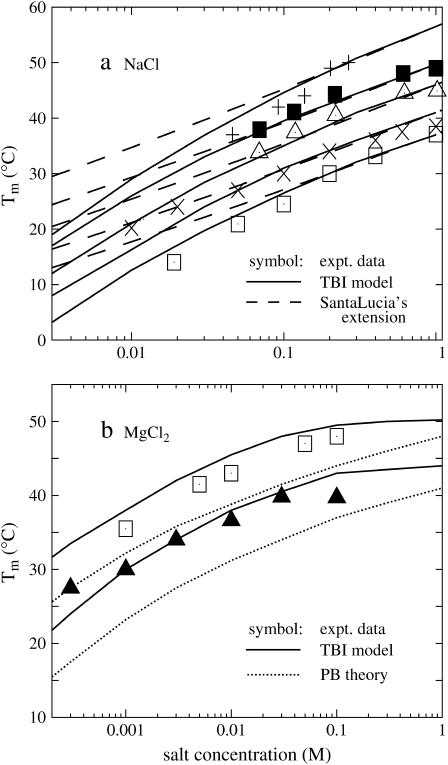
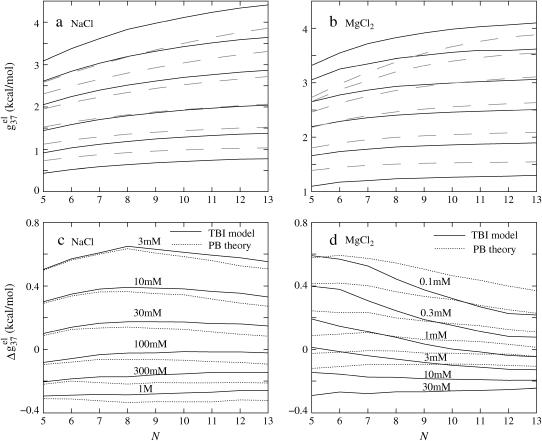
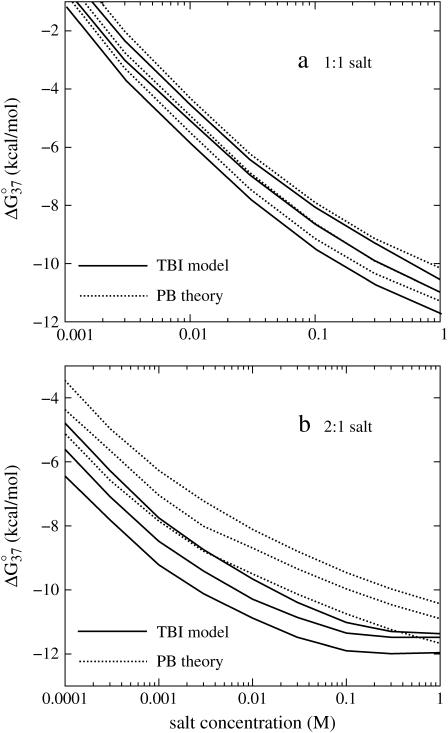
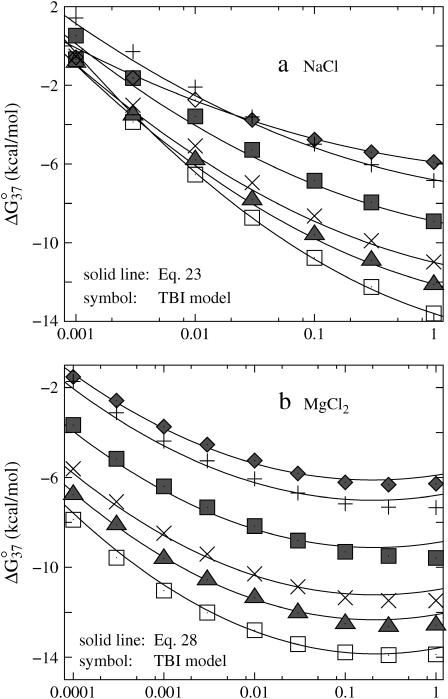
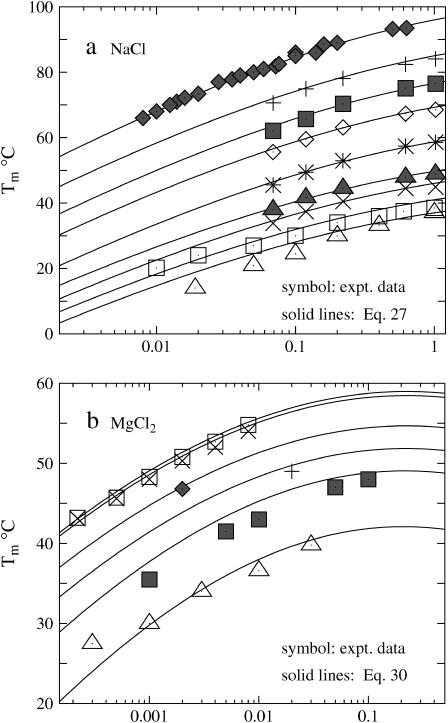
Metal ions play crucial roles in thermal stability and folding kinetics of nucleic acids. For ions (especially multivalent ions) in the close vicinity of nucleic acid surface, interion correlations and ion-binding mode fluctuations may be important. Poisson-Boltzmann theory ignores these effects whereas the recently developed tightly bound ion (TBI) theory explicitly accounts for these effects. Extensive experimental data demonstrate that the TBI theory gives improved predictions for multivalent ions (e.g., Mg2+) than the Poisson-Boltzmann theory. In this study, we use the TBI theory to investigate how the metal ions affect the folding stability of B-DNA helices. We quantitatively evaluate the effects of ion concentration, ion size and valence, and helix length on the helix stability. Moreover, we derive practically useful analytical formulas for the thermodynamic parameters as functions of finite helix length, ion type, and ion concentration. We find that the helix stability is additive for high ion concentration and long helix and nonadditive for low ion concentration and short helix. All these results are tested against and supported by extensive experimental data.


Figures

FIGURE 1
FIGURE 1
The tightly bound regions around (a) a 13-bp dsDNA and (b) a 13-nt ssDNA in Mg2+ solutions at bulk concentration [MgCl2] = 0.1 M. The red spheres represent the phosphate groups and the green dots represent the points on the boundaries of the tightly bound regions. The dsDNA and ssDNA are produced from the grooved primitive model (see Appendix A) (55,95).
FIGURE 2
FIGURE 2
(a,b) The electrostatic free energy formula image for dsDNA (black lines) and the respective ssDNA (gray lines) as functions of (a) NaCl and (b) MgCl2 concentrations. (Dotted lines) Poisson-Boltzmann theory; (solid lines) the TBI theory. (a) DNA length N are 10, 9, 8, and 6 bp (from the top to bottom), respectively; (b) DNA length N are 12, 9, and 6 bp (from the top to bottom), respectively. (c,d) The folding free energies ΔG°37 due to dsDNA helix formation for different sequences of various lengths in (c) NaCl and (d) MgCl2 solutions. (Dotted lines) Poisson-Boltzmann theory; (solid lines) the TBI theory; (dashed lines) SantaLucia's salt extrapolation formula for NaCl (22,40). (c) The sequences used for NaCl solution are: GCATGC, GGAATTCC, GCCAGTTAA, and ATCGTCTGGA (from the top to bottom). The symbols are the experimental data. + GCATGC (36); □ GGAATTCC (79); × GGAATTCC (80); ▵ GCCAGTTAA (37); ⋄ ATCGTCTGGA (82); ♦ are calculated from the nearest neighbor model with the thermodynamic parameters of SantaLucia at 1 M NaCl (22). (d) The sequences used for MgCl2 are: GCATGC, GCCAGTTAA, and AGAAAGAGAAGA (from the top to bottom). The symbols are the experimental data: ▪ GCCAGTTAA in MgCl2 (37); □ AGAAAGAGAAGA in MgCl2 (84); ▴ AGAAAGAGAAGA in MgCl2 (85); ♦ GCATGC in NaCl/MgCl2 mixed solution with 0.012 M NaCl (36). The experimental data in NaCl/MgCl2 mixed solutions for GCATGC are used for semiquantitative comparison because NaCl is at very low concentration (36). For the MgCl2 solutions, the values of formula image from the TBI theory are used in the calculations of ΔG37°.
FIGURE 3
FIGURE 3
The temperature-dependence of the folding free energy ΔG°T for (a) NaCl and (b) MgCl2 solutions. (Solid lines) The TBI theory; (dotted lines) experimental data with the use of the equation ΔGT° = ΔH° − TΔS°, where ΔH° and ΔS° are taken from experiments. (a) The upper three lines are for sequence GGAATTCC at 0.046, 0.1, and 0.267 M NaCl (from the top to bottom) (79,80), and the bottom three lines are for sequence ATCGTCTGGA at 0.069, 0.22, and 0.62 M NaCl (from the top to bottom) (82). (b) The three lines are for sequence GCCAGTTAA at 1, 10, and 100 mM MgCl2 (from the top to bottom) (37).
FIGURE 4
FIGURE 4
The temperature-dependence of the electrostatic part of the free energy. (a,b) The electrostatic free energy formula image of dsDNA (solid lines) and ssDNA (dashed lines) as functions of temperature: (a) for a 10-bp dsDNA and the respective ssDNA at 3 mM, 10 mM, 30 mM, 69 mM, 220 mM, and 1 M NaCl (from the top to bottom); (b) for a 9-bp dsDNA and the respective ssDNA at 0.1, 0.3, 1, 10, and 100 mM MgCl2 (from the top to bottom). (c,d) The temperature-dependence of electrostatic contribution formula image to folding free energy for dsDNA helix formation in (c) NaCl and (d) MgCl2 solutions. (Dotted lines) Poisson-Boltzmann theory; (solid lines) the TBI theory. (c) Sequence ATCGTCTGGA at 3 mM, 10 mM, 30 mM, 69 mM, 220 mM, and 1 M NaCl (from the top to bottom); (d) sequence GCCAGTTAA at 0.1, 0.3, 1, 10, and 100 mM MgCl2 (from the top to bottom).
FIGURE 5
FIGURE 5
The melting temperature Tm for dsDNA of different sequences in (a) NaCl and (b) MgCl2 solutions. (Solid lines) The TBI theory; (dotted lines) Poisson-Boltzmann theory; (dashed lines) SantaLucia's salt extension for NaCl (22,40); (symbols) the experimental data. (a) The sequences and total strand concentrations CS are (from the top to bottom): + GGAATTCC at CS = 3 mM (79); ▪ CCATTGCTACC at CS = 2 μM (35); ▵ ATCGTCTGGA at CS = 2 μM (35); × GCCAGTTAA at CS = 8 μM (37); and □ GGAATTCC at CS = 18.8 μM (81). (b) The sequences and CS are (from the top to bottom): □ AGAAAGAGAAGA at CS = 6 μM (84); and ▪ GCCAGTTAA at CS = 8 μM (37). Here, the data for AGAAAGAGAAGA are taken from the duplex melting in the study of the triplex melting in MgCl2 and CS = 6 μM is the total strand concentration for triplex formation. Tm is calculated from ΔG°TRTlnCS/6 = 0 (84).
FIGURE 6
FIGURE 6
The length-dependence of the electrostatic part of the free energy. formula image and formula image are the electrostatic free energies per base stack. N − 1 is the number of base stacks for a N-bp helix. (a,b) The electrostatic free energy formula image (per base stack) for dsDNA (solid lines) and the respective ssDNA (dashed lines) as functions of sequence length N in NaCl (a) and MgCl2 (b) solutions. (a) [NaCl] = 3 mM, 10 mM, 30 mM, 100 mM, 300 mM, and 1 M (from the top to bottom); (b) [MgCl2] = 0.1, 0.3, 1, 3, 10, and 30 mM (from the top to bottom). (c,d) The length N-dependence of electrostatic contribution formula image (per base stack) to folding free energy for dsDNA helix formation in NaCl (c) and MgCl2 (d) solutions. (Dotted lines) Poisson-Boltzmann theory; (solid lines) the TBI theory. [NaCl] = 3 mM, 10 mM, 30 mM, 100 mM, 300 mM, and 1 M (from the top to bottom); [MgCl2] = 0.1, 0.3, 1, 3, 10, and 30 mM (from the top to bottom).
FIGURE 7
FIGURE 7
The folding free energies ΔG°37 for dsDNA helix formation as functions of (a) 1:1 and (b) 2:1 salt concentrations for sequence ATCGTCTGGA. (Solid lines) The TBI theory; (dotted lines) Poisson-Boltzmann theory. (a) The radii of monovalent cations are: 3, 3.5, and 4 Å (from the bottom to top). (b) The radii of divalent cations are: 4, 4.5, and 5 Å (from the bottom to top), respectively.
FIGURE 8
FIGURE 8
The free energy change ΔG°37 for dsDNA helix formation as functions of (a) NaCl and (b) MgCl2 concentrations for the sequences: GCATGC, GGAATTCC, GCCAGTTAA, ATCGTCTGGA, CCATTGCTACC, and CCAAAGATTCCTC (from the top to bottom). (a) (Solid lines) The empirical relation Eq. 23; (symbols) calculated from the TBI theory. (b) (Solid lines) The empirical relation Eq. 28; (symbols) calculated from the TBI theory.
FIGURE 9
FIGURE 9
Comparisons between the empirical formulas (solid lines) for Tm (Eqs. 27 and 30) and experimental data (symbols) for (a) NaCl and (b) MgCl2 solutions. (a) The DNA sequences for NaCl solutions are (5′-3′): GGAATTCC (81), GCCAGTTAA (37), ATCGTCTGGA (82), CCATTGCTACC (35), ATCGTCTCGGTATAA (35), CCATCATTGTGTCTACCTCA (35), AATATCTCTCATGCGCCAAGCTACA (35), GTTATTCCGCAGT-CCGATGGCAGCAGGCTC (35), and E. coli (33) (from the bottom to top). (b) The sequences for MgCl2 solutions are (5′-3′): GCCAGTTAA (37), AGAAAGAGAAGA (84), TTTTTTTGTTTTTTT (38), TAATTTAAAATTTTTAAAAAA (88), TTTTTTTTTTATTAAAATTTATAAA (89), and AAAAAAAAAATAATTTTAAATATTT (89) (from the bottom to top). Tm(1 M Na+) is calculated from the nearest neighbor model with the thermodynamic parameters of SantaLucia (20) except for E. coli. For E. coli, Tm(1 M Na+) is taken as 96.5°C.

Similar articles

Cited by

References

    1. Tinoco, I., and C. Bustamante. 1999. How RNA folds. J. Mol. Biol. 293:271–281. - PubMed
    1. Rook, M. S., D. K. Treiber, and J. R. Williamson. 1999. An optimal Mg2+ concentration for kinetic folding of the Tetrahymena ribozyme. Proc. Natl. Acad. Sci. USA. 96:12471–12476. - PMC - PubMed
    1. Woodson, S. A. 2005. Metal ions and RNA folding: a highly charged topic with a dynamic future. Curr. Opin. Chem. Biol. 9:104–109. - PubMed
    1. Draper, D. E., D. Grilley, and A. M. Soto. 2005. Ions and RNA folding. Annu. Rev. Biophys. Biomol. Struct. 34:221–243. - PubMed
    1. Sosnick, T. R., and T. Pan. 2003. RNA folding: models and perspectives. Curr. Opin. Struct. Biol. 13:309–316. - PubMed

Publication types

LinkOut - more resources