. 2005 Dec;17(12):3257-81.
doi: 10.1105/tpc.105.035261. Epub 2005 Nov 18.

Sugars and circadian regulation make major contributions to the global regulation of diurnal gene expression in Arabidopsis

Affiliations
Free PMC article

Sugars and circadian regulation make major contributions to the global regulation of diurnal gene expression in Arabidopsis

Oliver E Bläsing et al. Plant Cell. 2005 Dec.
Free PMC article

Abstract

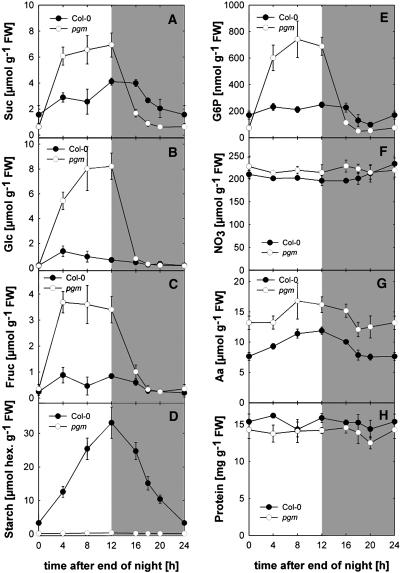
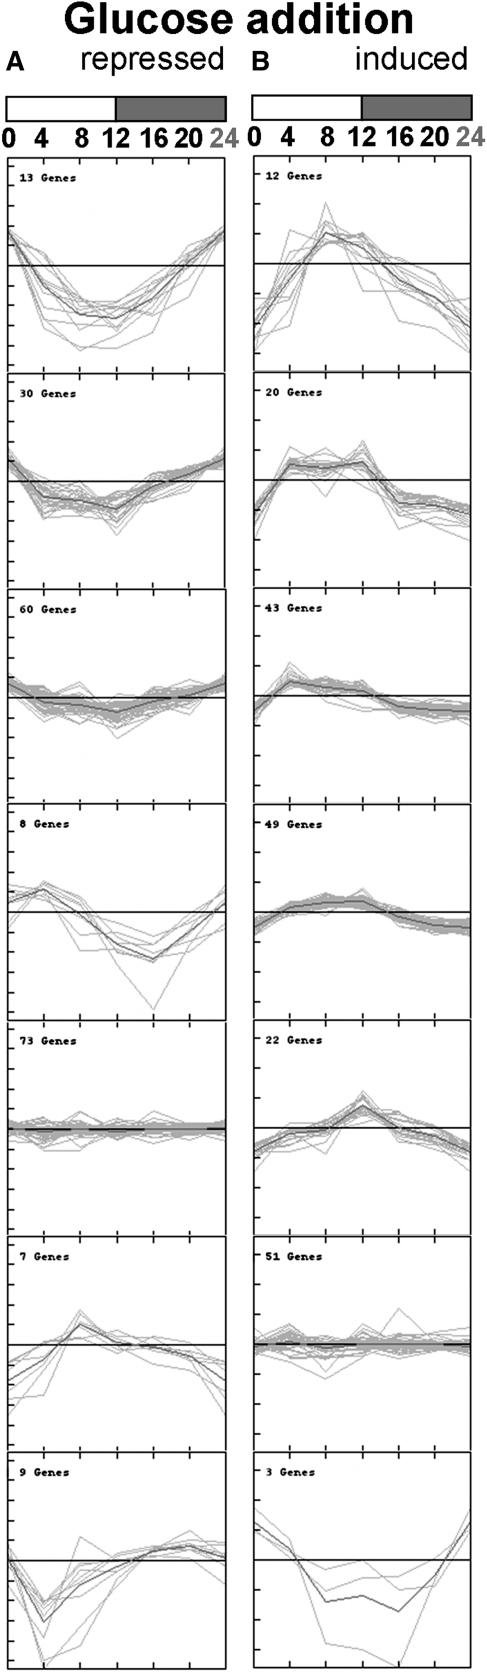
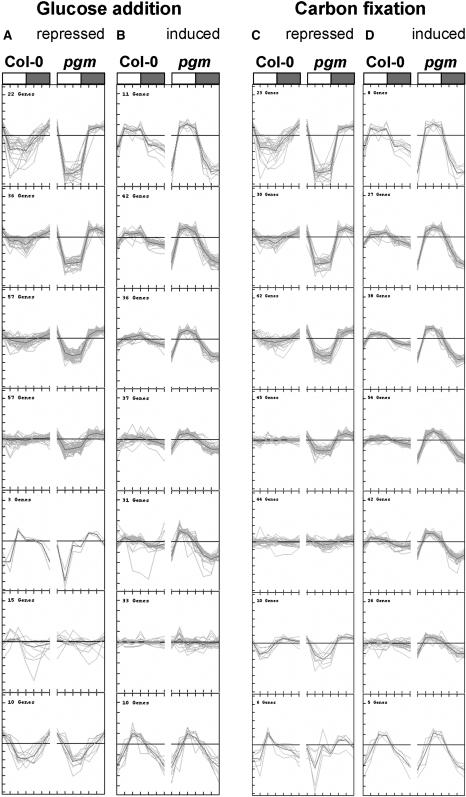
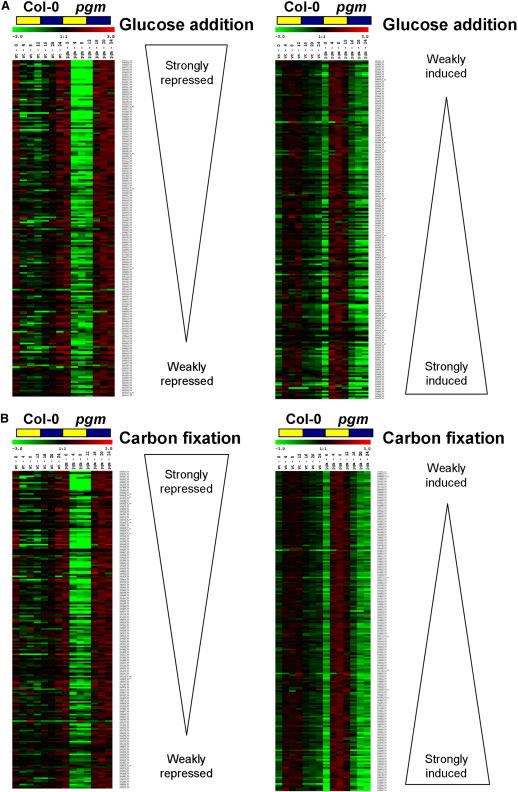
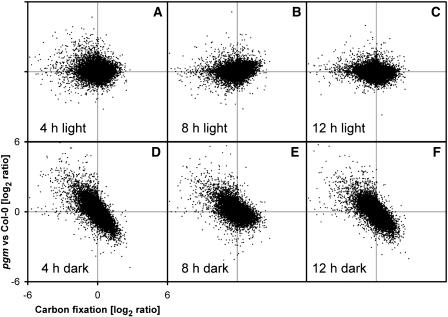
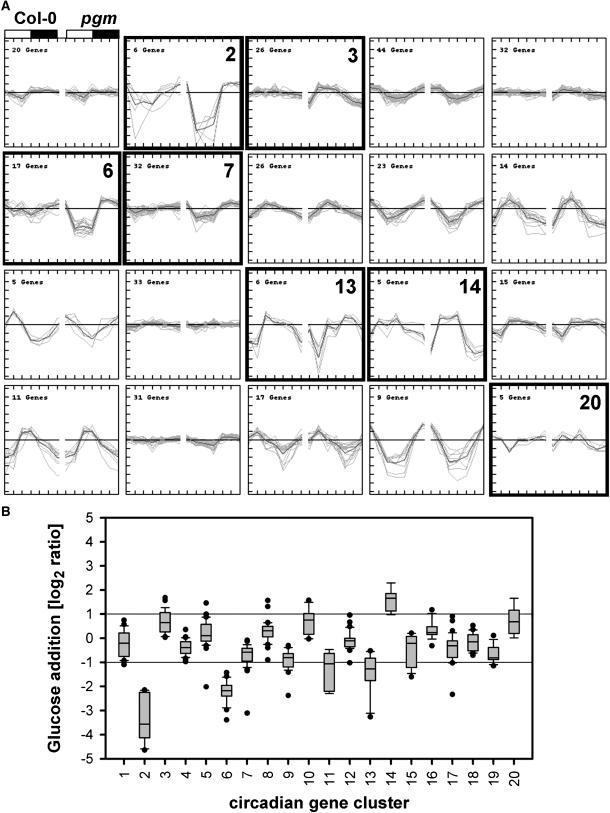
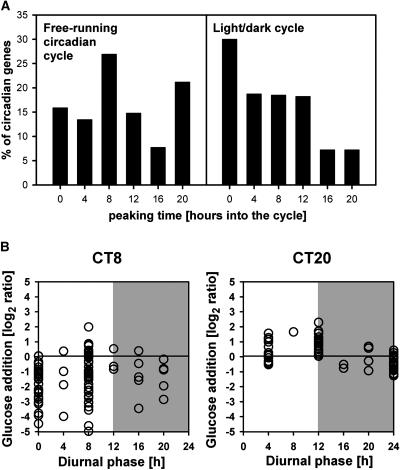
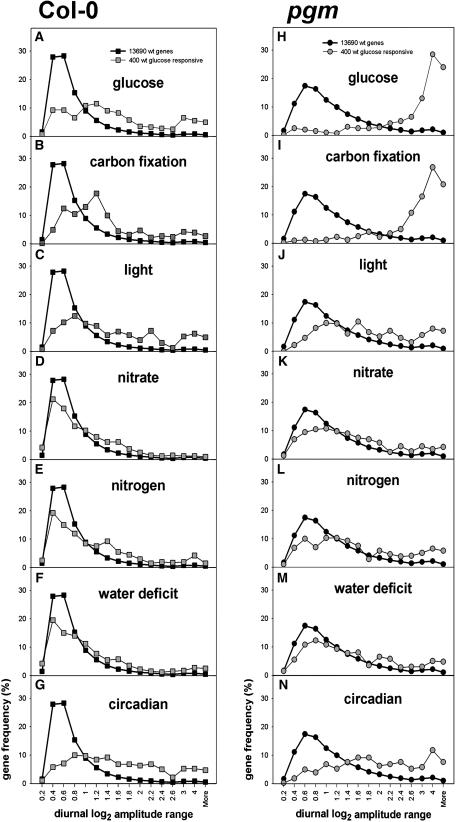
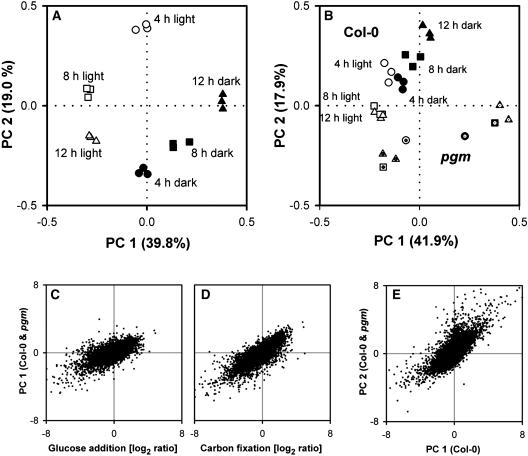
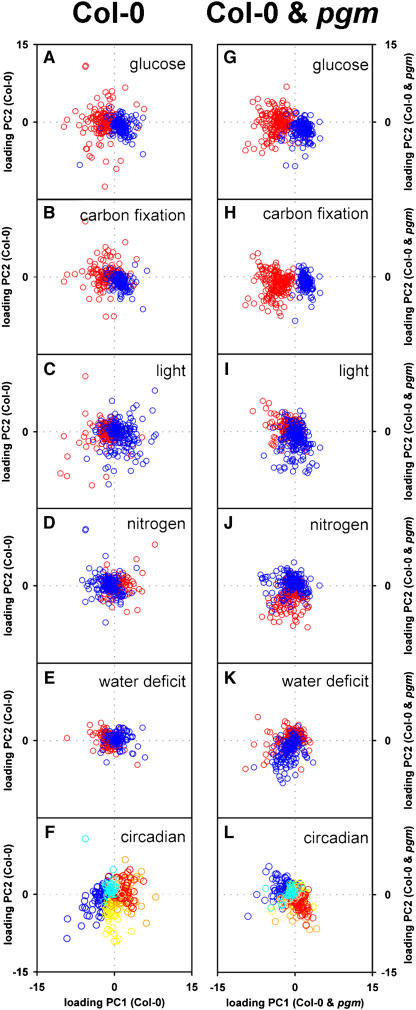
The diurnal cycle strongly influences many plant metabolic and physiological processes. Arabidopsis thaliana rosettes were harvested six times during 12-h-light/12-h-dark treatments to investigate changes in gene expression using ATH1 arrays. Diagnostic gene sets were identified from published or in-house expression profiles of the response to light, sugar, nitrogen, and water deficit in seedlings and 4 h of darkness or illumination at ambient or compensation point [CO(2)]. Many sugar-responsive genes showed large diurnal expression changes, whose timing matched that of the diurnal changes of sugars. A set of circadian-regulated genes also showed large diurnal changes in expression. Comparison of published results from a free-running cycle with the diurnal changes in Columbia-0 (Col-0) and the starchless phosphoglucomutase (pgm) mutant indicated that sugars modify the expression of up to half of the clock-regulated genes. Principle component analysis identified genes that make large contributions to diurnal changes and confirmed that sugar and circadian regulation are the major inputs in Col-0 but that sugars dominate the response in pgm. Most of the changes in pgm are triggered by low sugar levels during the night rather than high levels in the light, highlighting the importance of responses to low sugar in diurnal gene regulation. We identified a set of candidate regulatory genes that show robust responses to alterations in sugar levels and change markedly during the diurnal cycle.


Figures

Figure 1.
Figure 1.
Changes of Metabolites during the Diurnal Cycle in Wild-Type and pgm Rosettes. Wild-type Col-0 and pgm were grown in a 12-h-light/12-h-dark cycle as described in Methods. The whole rosette was harvested at the end of the night, 4, 8, and 12 h into the light period, and 4 and 8 h into the dark period. The results are given as the mean ± sd (n = 5 independent samples, each consisting of three rosettes). The results of one typical experiment from three biological replicates conducted at 2-month intervals are shown. FW, fresh weight. (A) Sucrose. (B) Glucose. (C) Fructose. (D) Starch. (E) Glucose-6-phosphate. (F) Nitrate. (G) Total amino acids. (H) Protein.
Figure 2.
Figure 2.
Amplitude of the Diurnal Changes in the Expression of Genes Assigned to Central Metabolism Displayed in MapMan. Genes with no significant change in the amplitude are depicted in white, and genes with an increasingly large amplitude are shown as an increasingly intense blue, with the scale saturating at an amplitude [log2(maximum/minimum)] of 3. TCA, tricarboxylic acid; CHO, carbohydrate; OPP, oxidative pentose phosphate. (A) Wild-type Col-0. The average amplitude is shown for three experiments, including 13,690 probe sets that were detected at least once throughout a diurnal cycle. (B) pgm mutant. The amplitude for 16,559 probe sets that were detected at least once throughout a diurnal cycle.
Figure 3.
Figure 3.
Frequency of the Timing of the Maxima and Minima for Genes That Show a Diurnal Change. The results are averaged for three biological replicates. The plots show the results for 3590 genes that have a maximum:minimum ratio >0.8 (A) and 456 genes that have a maximum:minimum ratio >2 (B) on a log2 scale. All genes for which the average correlation coefficient for three pair-wise comparisons of the three biological replicates was <0.5 were omitted.
Figure 4.
Figure 4.
Comparison of the Response of Genes to Addition of 100 mM Glucose to Carbon-Starved 7-d-Old Seedlings and the Response of Genes for 4 h in the Light at Ambient (350 ppm) [CO2] or Compensation Point (<50 ppm) [CO2]. A further treatment (data not shown) involved a 4-h extension of the night. The raw data are provided in the supplemental data online. The sugar levels in the material were as follows: 1.4 μmol·g FW sucrose, 0.7 μmol·g FW glucose, 0.8 μmol·g FW fructose after 4 h in the dark at compensation point [CO2], 1.3 μmol·g FW sucrose, 0.6 μmol·g FW glucose, 1.1 μmol·g FW fructose after 4 h in the light at compensation point [CO2] and 3.5 μmol·g FW sucrose, and 1.3 μmol·g FW glucose and 0.8 μmol·g FW fructose after 4 h light under ambient [CO2].
Figure 5.
Figure 5.
Clustering of 400 Glucose-Responsive Genes According to Their Response in the Diurnal Cycle in Wild-Type Rosettes. (A) The 200 glucose-repressed genes. (B) The 200 glucose-induced genes. The glucose-responsive genes were identified from an experiment in which 7-d-old Arabidopsis seedlings growing in liquid culture in full nutrient medium under weak continuous light were subjected to carbon starvation for 2 d, before adding 100 mM glucose for 3 h, and correspond to the 200 genes that show the largest repression and the 200 genes that show the largest induction. The genes are listed in Supplemental Table 6 online. The genes in the two sets were k-means clustered based on their diurnal response. For each gene, clustering was performed on the log2-transformed average values at each of the six times during the diurnal, normalized to the average level in the diurnal cycle. The 24-h point of time was copied from time 0. The number of genes in each cluster is given in each panel. The day/night cycle is indicated at the top of the first panel by a white (day) and a gray (night) bar.
Figure 6.
Figure 6.
Comparison of the Changes of Expression of Sugar-Responsive Genes during the Diurnal Cycle in Wild-Type Col-0 and in the Starchless pgm Mutant. Clustering of the diurnal responses of 200 glucose-repressed genes (A), 200 glucose-induced genes (B), 200 carbon fixation–repressed genes (C), and 200 carbon fixation–induced genes (D) in the diurnal cycle in wild-type Col-0 (left part of each panel) and pgm rosettes (right part of each panel). Glucose-responsive genes were identified, and the corresponding transcript data for a combined data set, including all diurnal time points for wild-type Col-0 and pgm, were subjected to k-clustering as in Figure 9. The day/night cycle is exemplarily indicated at the top of the first panel by a white (day) and a gray (night) bar.
Figure 7.
Figure 7.
Quantitative Comparison of the Changes of Expression of Sugar-Responsive Genes during the Diurnal Cycle in Wild-Type Col-0 and in the Starchless pgm Mutant. The 200 genes that were most strongly repressed (left side) or induced (right side) after adding 100 mM glucose to carbon-starved seedlings were ranked according to the size of the change in expression (A). The same approach was used for carbon fixation–responsive genes (B). The changes in expression at six time points during the diurnal cycle in wild-type Col-0 (left points) and pgm (right points) are shown on a false color scale. For Col-0, each data point is the average of three biological replicates, whereas for pgm, the data points are the average of duplicates at the end of the night and the end of the day and single determinations at the other four time points. These signals were normalized to the average level in the diurnal cycle in the respective genotype.
Figure 8.
Figure 8.
The Relation between the Changed Levels of Transcripts for Individual Genes in pgm Compared with Col-0 and the Response of These Genes to Glucose. For each of the 22,746 genes on the ATH1 array, the files (CEL) for Col-0 and pgm were combined and processed with RMA, and the level of each gene in pgm relative to Col-0 was calculated for each of the six harvest times and plotted on the y axis. For each gene, the response to endogenous changes of sugars was extracted from the experiment in which rosettes were illuminated for 4 h at ambient or compensation point [CO2] and plotted on the x axis.
Figure 9.
Figure 9.
Responses of a Subset of Circadian-Regulated Genes during the Diurnal Cycle in Wild-Type Plants and pgm. (A) K-means clustering of the responses of 373 circadian genes (taken from Harmer et al., 2000) during a diurnal cycle in wild-type Col-0 (left part of the panels) and pgm (right parts of the panels). The day/night cycle is exemplarily indicated at the top of the first panel by a white (day) and a gray (night) bar. Black boxed panels (clusters 2, 3, 6, 7, 12, 13, and 20) contain circadian genes that behave differently in wild-type and pgm mutant plants. When compared with the results of the glucose starvation–readdition experiment, genes from panels 2, 6, and 7 are induced under low sugar and repressed under sugar starvation, whereas genes from panels 3 and 14 are induced by high sugar and repressed under low sugar. (B) Response of the genes in each of the individual clusters to the addition of 15 mM glucose to carbon-starved seedlings.
Figure 10.
Figure 10.
Responses of a Subset of Circadian-Regulated Genes during the Diurnal Cycle in Wild-Type Plants. (A) Peaking times of 373 circadian clock regulated genes in a free-running circadian cycle (Harmer et al., 2000) and in the diurnal cycle in wild-type Col-0 extracted from the mean of the three biological replicates. (B) Phase shift of the circadian peaking time (CT) into the diurnal time (x axis) in wild-type Col-0 and the corresponding sugar response (y axis) in a seedling culture after adding 15 mM glucose to carbon-starved seedlings. The phase shift is shown for CT8 and CT20 and for the remaining times in Supplemental Figure 6 online.
Figure 11.
Figure 11.
Comparison of the Amplitudes of the Diurnal Changes of Genes Responsive to Sugar, Light, Nitrogen, Water Stress, and Circadian Clock Regulation Compared with the Diurnal Changes of All Detectable Genes on the ATH1 Array. The results are taken from Figure 6 for glucose- and carbon fixation–responsive genes, from the corresponding data for sucrose, light, photomorphogenetic light, nitrogen, and water deficit in the supplemental data online, and from Figure 9 for circadian-regulated genes.
Figure 12.
Figure 12.
Principle Component Analysis of Samples Collected at Different Times during the Diurnal Cycle from Wild-Type Col-0 and pgm. (A) Separation of Col-0 samples by the first and second components. These are shown on the x and y axes and account for 40 and 19% of the total variation, respectively. Each biological replicate is shown separately. The data set contains triplicate samples for all six time points in the Col-0 diurnal cycle and includes 13,690 genes that were called present for at least one time point in each biological replicate. Circles, boxes, and triangles indicate time points at 4, 8, and 12 h into the light (open items) and dark (closed items) periods, respectively. (B) Separation of a combined data set for wild-type Col-0 and pgm by the first and second components. These are shown on the x and y axes and account for 42 and 18% of the total variation, respectively. The data set contains triplicate samples for all six time points in the Col-0 diurnal cycle, duplicate samples for the end of the night and end of the dark period in pgm, and single samples for other four time points in pgm and includes 16,559 genes that were called present for at least one time point in one genotype. Circles, boxes, and triangles indicate time points at 4, 8, and 12 h into the light (open items) and dark (closed items) periods, respectively. Symbols for pgm contain a dot. (C) and (D) Correlation between the response of gene expression 3 h after addition of glucose to carbon-starved seedlings (C) or the response of gene expression to carbon fixation and the weightings of genes in the first principle component ([D]; see [B]) separating diurnal samples from Col-0 and pgm during the diurnal cycle. (E) Comparison of the first component separating diurnal Col-0 samples ([A], x axis) and the second component separating diurnal samples from Col-0 and pgm ([B], y axis).
Figure 13.
Figure 13.
Weightings in the First and Second Principle Components of the Subsets of Genes That Are Responsive to Glucose, Carbon Fixation, Light, Nitrogen, Water Stress, and Circadian Regulation. The genes in the subsets of 200 glucose-, carbon fixation–, light-, nitrogen- (3 h), and water deficit–induced and 200 glucose-, carbon fixation–, light-, nitrogen- (3 h), and water deficit–repressed genes (see Supplemental Table 6 online) and the 373 circadian-regulated genes (see Supplemental Table 11 online) were compared with the weightings of all genes in the first and second components of Figures 12A and 12B (see Supplemental Table 1 online for the individual values) to identify the weightings for these selected subsets of genes. The weightings (loadings) in the first two components that separate Col-0 samples ([A] to [F]) and the first two components that separate the combined set of Col-0 and pgm samples ([F] to [L]) were plotted for all members of the gene subsets responsive to glucose ([A] and [G]), carbon fixation ([B] and [H]), light ([C] and [I]), nitrogen ([D] and [J]), water deficit ([E] and [K]), and circadian regulation ([F] and [L]). Each gene is shown as a point, and its weightings in the first and second components by its position along the x axis and y axis, respectively. As a weighting can be positive or negative, the axes intersect in the center of the plot. For genes responsive to glucose, carbon fixation, light, nitrogen, and water deficit, different colors were used to distinguish between induced (blue) and repressed (red) genes. Induced genes are plotted over the repressed genes, with the result that the data for repressed genes is obscured when they are located in an area that has a high density of induced genes. Similar results were obtained by plotting all genes that showed a more than twofold change to each of these inputs (see Supplemental Figure 9 online). Circadian-regulated genes are shown in color according to the phase when they peak in the diurnal cycle. Gray, magenta, and dark blue indicate peak phases of 4, 8, and 12 h in the dark, while yellow, orange, and red indicate the peaking in 4, 8, and 12 h of light. The average value for the signal at each time point was used for the clusters shown in Figures 5 and 7 and the supplemental data online, which are the basis of the calculations for this figure.

References

    1. Benjamini, Y., and Hochberg, Y. (1995). Controlling the false discovery rate: A practical and powerful approach to multiple testing. J. R. Stat. Soc. B 57 289–300.
    1. Bolstad, B.M., Irizarry, R.A., Astrand, M., and Speed, T.P. (2003). A comparison of normalization methods for high density oligonucleotide array data based on bias and variance. Bioinformatics 19 185–193. - PubMed
    1. Calikowski, T.T., Meulia, T., and Meier, I. (2003). A proteomic study of the Arabidopsis nuclear matrix. J. Cell. Biochem. 90 361–378. - PubMed
    1. Caspar, T., Huber, S.C., and Somerville, C.R. (1985). Alterations in growth, photosynthesis and respiration in a starch deficient mutant of Arabidopsis thaliana (L.) Heynh deficient in chloroplast phosphoglucomutase. Plant Physiol. 79 11–17. - PMC - PubMed
    1. Celenza, J.L., Quiel, J.A., Smolen, G.A., Merrikh, H., Silvestro, A.R., Normanly, J., and Bender, J. (2005). The Arabidopsis ATR1 Myb transcription factor controls indolic glucosinolate homeostasis. Plant Physiol. 137 253–262. - PMC - PubMed

Publication types

Associated data