. 2005 Nov 23;48(4):577-89.
doi: 10.1016/j.neuron.2005.10.026.

Ephrin-as guide the formation of functional maps in the visual cortex

Affiliations

Ephrin-as guide the formation of functional maps in the visual cortex

Jianhua Cang et al. Neuron. .

Abstract

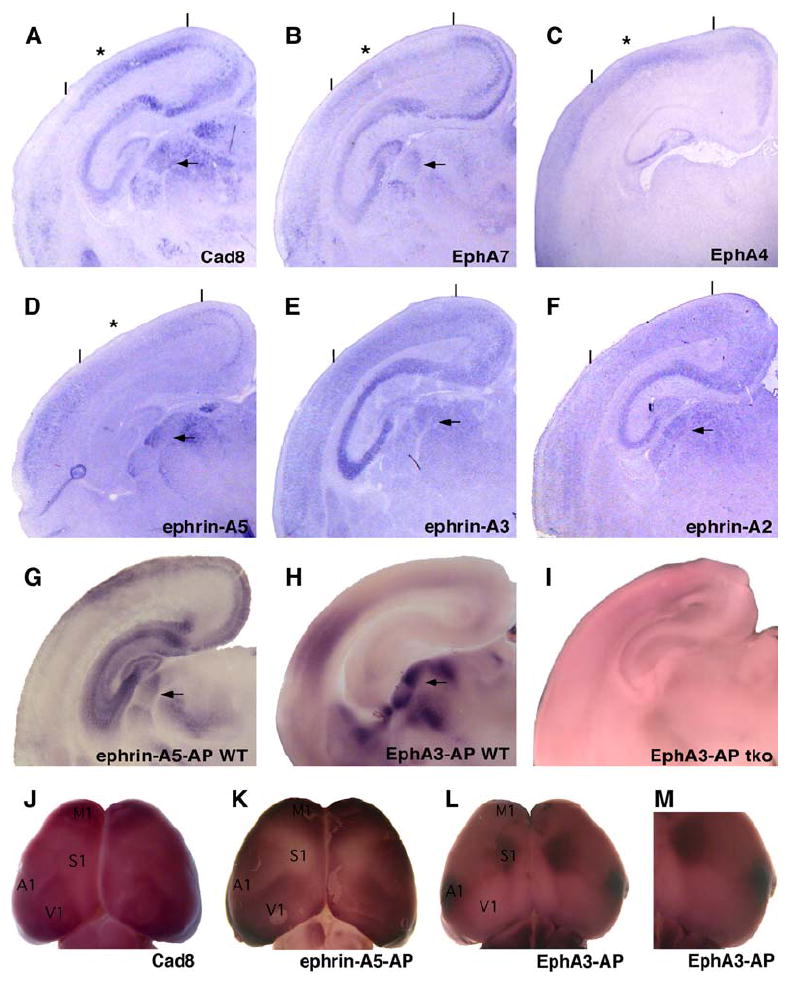
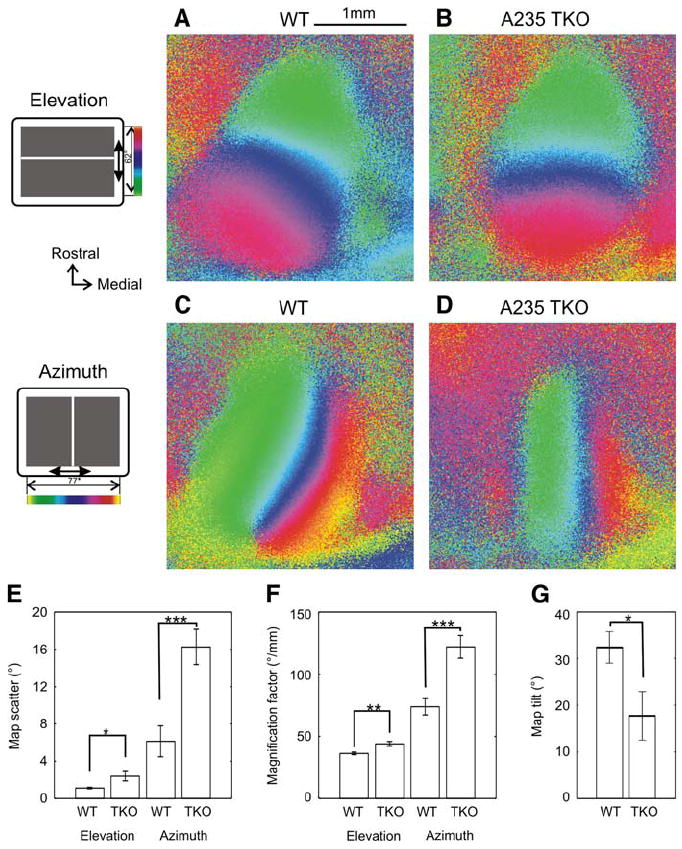
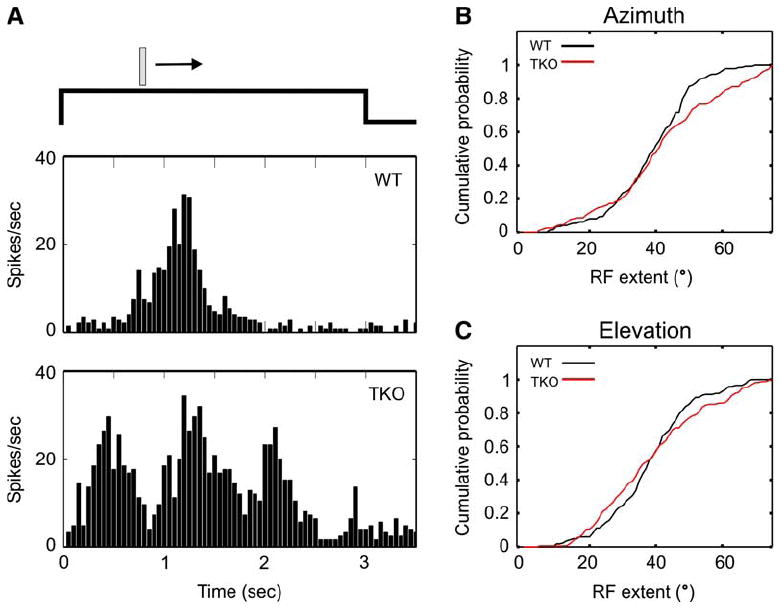
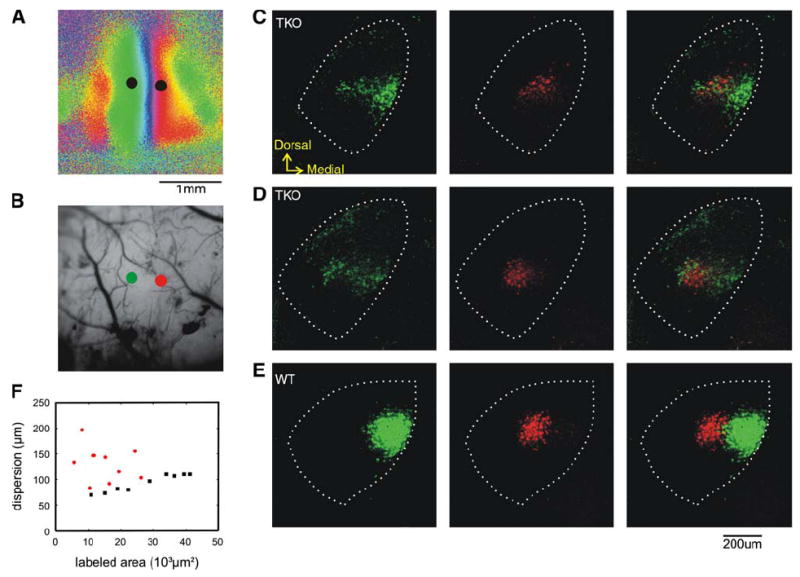
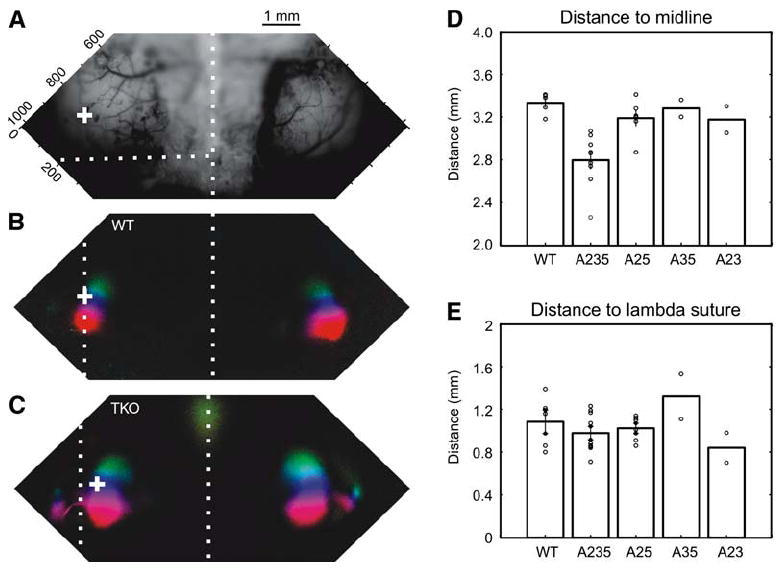
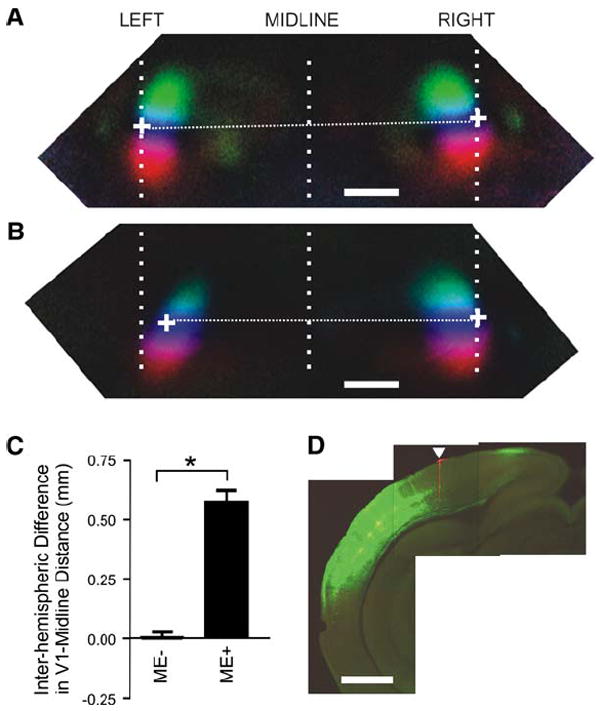
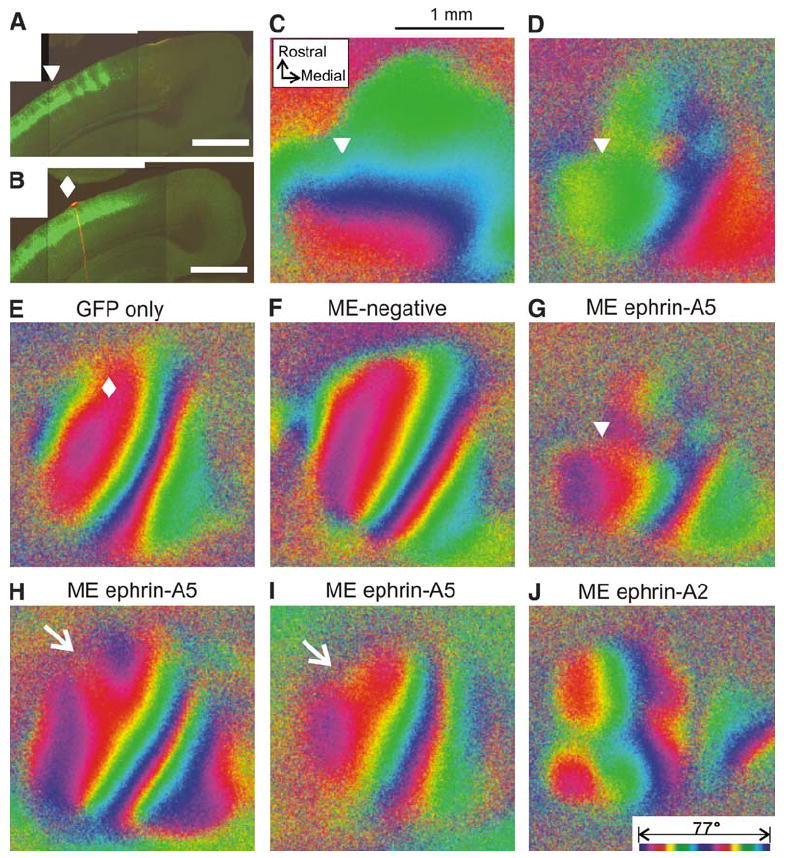
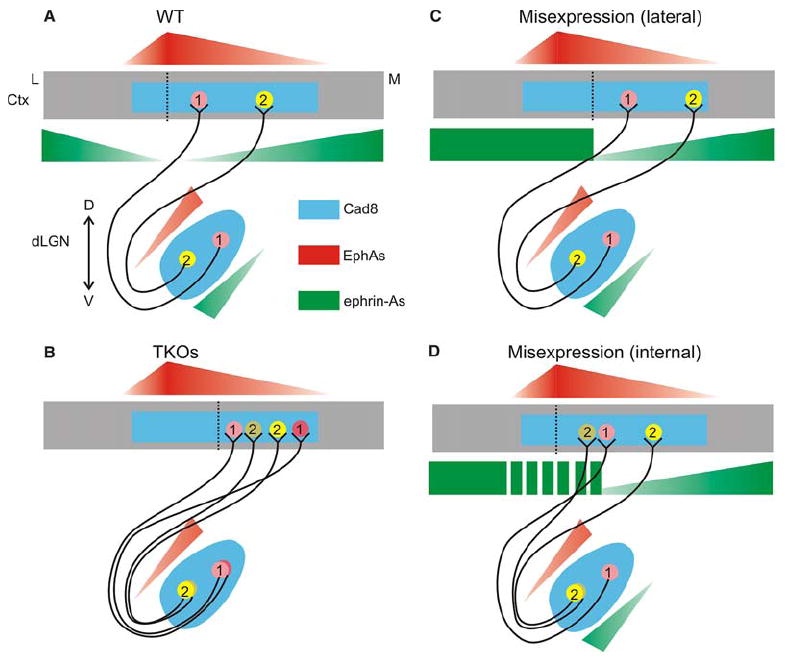
Ephrin-As and their receptors, EphAs, are expressed in the developing cortex where they may act to organize thalamic inputs. Here, we map the visual cortex (V1) in mice deficient for ephrin-A2, -A3, and -A5 functionally, using intrinsic signal optical imaging and microelectrode recording, and structurally, by anatomical tracing of thalamocortical projections. V1 is shifted medially, rotated, and compressed and its internal organization is degraded. Expressing ephrin-A5 ectopically by in utero electroporation in the lateral cortex shifts the map of V1 medially, and expression within V1 disrupts its internal organization. These findings indicate that interactions between gradients of EphA/ephrin-A in the cortex guide map formation, but that factors other than redundant ephrin-As are responsible for the remnant map. Together with earlier work on the retinogeniculate map, the current findings show that the same molecular interactions may operate at successive stages of the visual pathway to organize maps.


Figures

Figure 1
Figure 1. Expression of EphA Receptors and Ephrin-A Ligands in the Developing Visual Cortex
(A–F) Coronal sections from P4 mouse posterior cortex were treated with hybridization probes for Cadherin-8 (Cad8) (A), EphA7 (B), EphA4 (C), ephrin-A5 (D), ephrin-A3 (E), and ephrin-A2 (F). * indicates inflection point in expression. (G–I) Coronal sections were stained with ephrin-A5-AP (G) in wild-type (WT) or EphA3-AP (H and I) in WT and ephrin-A TKO mice. Lines indicate approximate boundaries of the visual cortex as assayed by Cad8 expression. Arrows indicate dLGN. Dorsal is at the top, medial is at the right of each panel. (J–M) Whole-mount views comparing Cad8 RNA expression with EphA and ephrin-A protein expression in P4 cortex. (J) Whole-mount RNA in situ hybridization detecting Cad8 RNA expression. (K) Ephrin-A5-AP (detects EphA protein) staining shows EphA protein overlapping with Cad8 in posterior cortex. (L and M) EphA3-AP (detects ephrin-A protein) shows a complementary binding pattern to that of ephrin-A5-AP that is highest surrounding Cad8. M1, primary motor cortex; S1, primary somatosensory cortex; A1, primary auditory cortex; V1, primary visual cortex. Location of the cortical areas is approximate at P4 and is based on (Hamasaki et al., 2004).
Figure 2
Figure 2. Abnormal Retinotopic Maps in the Cortex of Ephrin-A TKOs
(A and B) Cortical elevation maps of a WT (A) and an ephrin-A TKO mouse (B). The color code used to represent positions of different elevation lines on the stimulus monitor is shown to the left of (A). (C and D) Azimuth maps of the same WT (C) and ephrin-A TKO mouse (D). The color code is shown to the left. (E) Map scatters of cortical retinotopy. Both elevation and azimuth maps of ephrin TKOs were more scattered than the control maps (*p < 0.05; ***p < 0.001). (F) Ephrin-A TKOs have bigger cortical magnification factors for both elevation (**p < 0.01) and azimuth (***p < 0.001). (G) The orientation of V1 in relation to the lambda suture is altered in the ephrin-A TKO (*p < 0.05). Error bars represent the mean ± SEM.
Figure 3
Figure 3. Abnormal Cortical Response Patterns in Ephrin-A TKOs
(A) Examples of cortical spiking responses to a moving bar. The peristimulus time histogram (PSTH) of a typical WT response is shown in the upper panel. About 20% of recording sites in ephrin-A TKOs displayed multiple peaks in response to the moving bar, and a representative example is shown in the bottom panel. (B and C) Cumulative probability plots of the extent of the visual space that elicited responses for individual recording sites. For azimuth (B), the receptive field (RF) extent was significantly greater in the ephrin-A TKO (p = 0.02, K-S test). For elevation (C), the RF extent was similar between WT and ephrin-A TKOs (p = 0.29, K-S test).
Figure 4
Figure 4. Abnormal Geniculocortical Projection Patterns in Ephrin-A TKOs
(A and B) Azimuth map (A) of an ephrin-A TKO and the vascular pattern (B) in the region of cortex imaged. The two dots on each panel indicate the positions where the retrograde labeling marker CTBs were injected. In (B), the green and red dots mark the injection positions of the corresponding color of CTB. (C–E) Retrogradely labeled dLGN neurons in this ephrin-A TKO ([C] and [D] show two different coronal sections) and a WT control (E). Neurons labeled by CTB-Alexa488 (green, left column), CTB-Alexa568 (red, middle column), and the overlay of the two (right column) are shown. In all of the panels, dotted lines mark the border of the dLGN. (F) Quantification of label dispersion in the dLGN. The distance within which 80% of the labeled pixels were found is plotted against the area occupied by labeled pixels. Red dots, ephrin-A TKO, black dots, wild-type.
Figure 5
Figure 5. Ephrin-A TKOs Have Medial-Lateral Positioning Defects in Primary Visual Cortex
(A) Surface vasculature pattern of the imaged cortical area of a WT mouse. The midline and lambda sutures are indicated by the vertical and horizontal white dotted lines, respectively. (B) Elevation map of V1 from a WT mouse, shown as a polar map in which color encodes visual field position according to the scale in Figure 2, and brightness represents the magnitude of the response. “+” marks the position of 0° elevation at the V1/V2 border. (C) Elevation map of an ephrin-A TKO. (D) The distances from V1/V2 border to the midline are plotted for the five genotypes: WT, TKO (A235), and the three types of double KOs, ephrin-A2/A5 (A25), ephrin-A3/5 (A35), and ephrin-A2/A3 (A23). Only the triple KO is significantly different from the WT (p < 0.01). (E) The visual cortex position of the five genotypes is similar along the anterior-posterior axis of the cortex, measured as the distance to the back of the brain (p > 0.05 for all comparisons). Error bars represent the mean ± SEM.
Figure 6
Figure 6. Lateral Misexpression of Ephrin-A5 Shifts V1 Medially
(A–D) Misexpression of ephrin-A5 in caudal cortex just lateral to V1 caused V1 to shift medially. Medium-resolution retinotopic maps in a ME− animal (A) and a ME+ animal (B). Visually evoked responses in both hemispheres were simultaneously imaged, and the position of V1 was analyzed using the same method as that described in Figure 5. White crosses indicate the position of the V1/V2 border at 0° elevation. RIGHT, right hemisphere; LEFT, left hemisphere; MIDLINE, the line corresponding to the sagittal suture. (C) Differences in the V1/V2 border-midline distance between left and right hemispheres of ME− (n = 23) and ME+ animals (n = 10), *p < 0.001. (D) A coronal section of the left hemisphere from the animal shown in (B), showing an intense GFP signal in the dorsolateral cerebral wall. The section is at approximately mid-V1 level in its rostrocaudal extent. The arrowhead indicates the position of the DiI mark at the lateral margin of V1. All scale bars, 1.0 mm. Error bars represent the mean ± SEM.
Figure 7
Figure 7. Misexpression of Ephrin-A5 within V1 Disrupts Functional Retinotopy
(A and B) Coronal sections of the left caudal cortex from animals that received electroporation of ephrin-A5 and GFP (A) and GFP only (B). The arrowhead in (A) and the diamond in (B) indicate the position of the DiI marker corresponding to their positions in (C), (D), and (G) and in (E), respectively. GFP expression extends medially to the DiI marker indicating that the expression is present within as well as lateral to V1. (C and D) Functional elevation (C) and azimuth (D) maps in the left cortex from the animal shown in (A). The color codes representing positions on the stimulus monitor are the same as those in Figure 2. (E–J) Azimuth maps in control (E and F) and experimental animals (G–J). In (E)–(J), the visual field is represented by two cycles of colors (bottom of [J]) instead of a single cycle as shown in (B), to reveal the retinotopic structure at higher resolution. The control animal in (E) received electroporation of GFP plasmid alone, the expression of which is shown in (B). The diamond indicates the DiI injection site. The other control animal (F) had received GFP and ephrin-A5 plasmids by electroporation, but did not show clear expression. (G) The same map as in (D), except using the double color scale. (H and I) Additional examples of disrupted azimuth maps in animals that showed ephrin-A5 misexpression within V1. Note that in both of these maps, the lateral red isoazimuth contour bifurcates rostrally (arrows) in the area where ectopic ephrin-A5 expression was detected. (J) An example of a disrupted azimuth map in an animal in which ephrin-A2 was misexpressed within V1. All scale bars, 1.0 mm.
Figure 8
Figure 8. EphA/ephrin-A Interactions Are Required for the Position and Internal Order of the Primary Visual Cortex
(A) Expression of EphA receptors and ephrin-A ligands in the developing geniculocortical projection. Cadherin-8 (Cad8) (and perhaps other cadherin family members, blue) is expressed in both dLGN and visual cortex and marks available territory for LGN neurons. Neurons in the dorsal-medial dLGN (pink circle 1) that contain high amounts of EphA receptor (red) and low amounts of ephrin-A ligand (green) project to lateral V1, while ventral-lateral dLGN neurons containing high ephrin-A and low EphA (yellow circle 2) map to medial V1. These gradients are proposed to instruct the internal order of V1 via their graded repellent activities toward one another. High expression of ephrin-As both lateral and medial to visual cortex is proposed to act as a barrier for dLGN axons and place visual cortex in its stereotypic location. These gradients may also be used to map the topographic projection from V1 to V2 in a similar manner. (B) In ephrin-A TKO mice, ephrin-As are removed from the dLGN and cortex. This affects both the position of V1 and the internal order of the topographic map. V1 shifts medially in the absence of repulsion from high ephrin-A expression within the Cad8 permissive zone. (C and D) Misexpression of ephrin-As lateral to visual cortex repels V1 medially, but maintains internal order, while expression of patches of ephrin-A within V1 disrupts the V1 map. Ctx, cortex; D, dorsal; V, ventral; M, medial; L, lateral. Dotted lines indicate the V1/V2 boundary.

Comment in

References

    1. Agmon A, Yang LT, O’Dowd DK, Jones EG. Organized growth of thalamocortical axons from the deep tier of terminations into layer IV of developing mouse barrel cortex. J Neurosci. 1993;13:5365–5382. - PMC - PubMed
    1. Agmon A, Yang LT, Jones EG, O’Dowd DK. Topological precision in the thalamic projection to neonatal mouse barrel cortex. J Neurosci. 1995;15:549–561. - PMC - PubMed
    1. Bishop KM, Goudreau G, O’Leary DD. Regulation of area identity in the mammalian neocortex by Emx2 and Pax6. Science. 2000;288:344–349. - PubMed
    1. Bishop KM, Rubenstein JL, O’Leary DD. Distinct actions of Emx1, Emx2, and Pax6 in regulating the specification of areas in the developing neocortex. J Neurosci. 2002;22:7627–7638. - PMC - PubMed
    1. Bolz J, Uziel D, Muhlfriedel S, Gullmar A, Peuckert C, Zarbalis K, Wurst W, Torii M, Levitt P. Multiple roles of ephrins during the formation of thalamocortical projections: maps and more. J Neurobiol. 2004;59:82–94. - PubMed

Publication types

MeSH terms