Activation-coupled inactivation in the bacterial potassium channel KcsA
- PMID: 16301524
- PMCID: PMC1287484
- DOI: 10.1073/pnas.0505158102
Activation-coupled inactivation in the bacterial potassium channel KcsA
Abstract
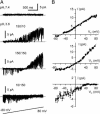
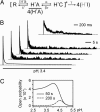
X-ray structures of the bacterial K+ channel KcsA have led to unparalleled progress in our understanding of ion channel structures. The KcsA channel has therefore been a prototypic model used to study the structural basis of ion channel function, including the gating mechanism. This channel was previously found to close at near-neutral intracellular pH (pH(i)) and to open at acidic pH(i). Here, we report the presence of a previously unknown channel inactivation process that occurs after the KcsA channel is activated. In our experiments, mammalian cells transfected with a codon-optimized synthetic gene encoding the KcsA protein expressed K+-selective channels that activated in response to a decrease in pH(i). Using patch-clamp and rapid solution exchange techniques, we observed that the KcsA channels inactivated within hundreds of milliseconds after channel activation. At all tested pHs, inactivation always accompanied activation, and it was profoundly accelerated in the same pH range at which activation increased steeply. Recovery from inactivation was observed, and its extent depended on the pH(i) and the amount of time that the channel was inactive. KcsA channel inactivation can be described by a kinetic model in which pH(i) controls inactivation through pH-dependent activation. This heretofore-undocumented inactivation process increases the complexity of KcsA channel function, but it also offers a potential model for studying the structural correspondence of ion channel inactivation.
Figures


Similar articles
-
Structural basis underlying the dual gate properties of KcsA.Proc Natl Acad Sci U S A. 2010 Apr 6;107(14):6216-21. doi: 10.1073/pnas.0911270107. Epub 2010 Mar 8. Proc Natl Acad Sci U S A. 2010. PMID: 20212150 Free PMC article.
-
Molecular determinants of gating at the potassium-channel selectivity filter.Nat Struct Mol Biol. 2006 Apr;13(4):311-8. doi: 10.1038/nsmb1069. Epub 2006 Mar 12. Nat Struct Mol Biol. 2006. PMID: 16532009
-
A quantitative description of KcsA gating I: macroscopic currents.J Gen Physiol. 2007 Nov;130(5):465-78. doi: 10.1085/jgp.200709843. Epub 2007 Oct 15. J Gen Physiol. 2007. PMID: 17938230 Free PMC article.
-
Diverse gating in K+ channels: differential role of the pore-helix glutamate in stabilizing the channel pore.Biochem Biophys Res Commun. 2011 Sep 16;413(1):1-4. doi: 10.1016/j.bbrc.2011.08.062. Epub 2011 Aug 22. Biochem Biophys Res Commun. 2011. PMID: 21872570 Review.
-
Modulation of Function, Structure and Clustering of K+ Channels by Lipids: Lessons Learnt from KcsA.Int J Mol Sci. 2020 Apr 7;21(7):2554. doi: 10.3390/ijms21072554. Int J Mol Sci. 2020. PMID: 32272616 Free PMC article. Review.
Cited by
-
Molecular template for a voltage sensor in a novel K+ channel. III. Functional reconstitution of a sensorless pore module from a prokaryotic Kv channel.J Gen Physiol. 2008 Dec;132(6):651-66. doi: 10.1085/jgp.200810077. J Gen Physiol. 2008. PMID: 19029373 Free PMC article.
-
Hysteresis of KcsA potassium channel's activation- deactivation gating is caused by structural changes at the channel's selectivity filter.Proc Natl Acad Sci U S A. 2017 Mar 21;114(12):3234-3239. doi: 10.1073/pnas.1618101114. Epub 2017 Mar 6. Proc Natl Acad Sci U S A. 2017. PMID: 28265056 Free PMC article.
-
Modeling control and transduction of electrochemical gradients in acid-stressed bacteria.iScience. 2023 Jun 17;26(7):107140. doi: 10.1016/j.isci.2023.107140. eCollection 2023 Jul 21. iScience. 2023. PMID: 37404371 Free PMC article.
-
Inactivation of the KcsA potassium channel explored with heterotetramers.J Gen Physiol. 2010 Jan;135(1):29-42. doi: 10.1085/jgp.200910305. J Gen Physiol. 2010. PMID: 20038524 Free PMC article.
-
Mechanism of Cd2+ coordination during slow inactivation in potassium channels.Structure. 2012 Aug 8;20(8):1332-42. doi: 10.1016/j.str.2012.03.027. Epub 2012 Jul 5. Structure. 2012. PMID: 22771214 Free PMC article.
References
-
- Doyle, D. A., Morais, C. J., Pfuetzner, R. A., Kuo, A., Gulbis, J. M., Cohen, S. L., Chait, B. T. & MacKinnon, R. (1998) Science 280, 69–77. - PubMed
-
- Zhou, Y., Morais-Cabral, J. H., Kaufman, A. & MacKinnon, R. (2001) Nature 414, 43–48. - PubMed
-
- Lenaeus, M. J., Vamvouka, M., Focia, P. J. & Gross, A. (2005) Nat. Struct. Mol. Biol. 12, 454–459. - PubMed
-
- Jiang, Y., Lee, A., Chen, J., Cadene, M., Chait, B. T. & MacKinnon, R. (2002) Nature 417, 515–522. - PubMed
-
- Jiang, Y., Lee, A., Chen, J., Ruta, V., Cadene, M., Chait, B. T. & MacKinnon, R. (2003) Nature 423, 33–41. - PubMed
Publication types
MeSH terms
Substances
Grants and funding
LinkOut - more resources
Full Text Sources

