Comparative Study
. 2005 Nov 29;102(48):17302-7.
doi: 10.1073/pnas.0508649102. Epub 2005 Nov 21.

A data integration methodology for systems biology: experimental verification

Affiliations
Comparative Study

A data integration methodology for systems biology: experimental verification

Daehee Hwang et al. Proc Natl Acad Sci U S A. .

Abstract

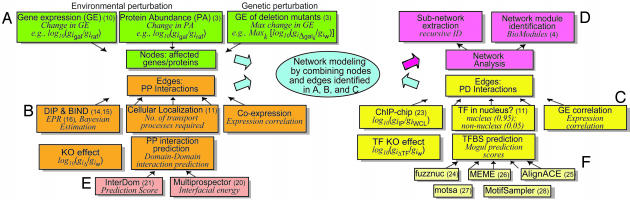
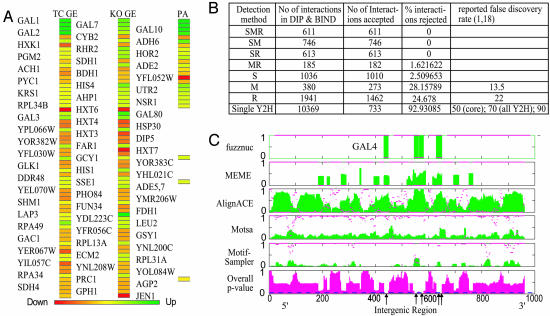
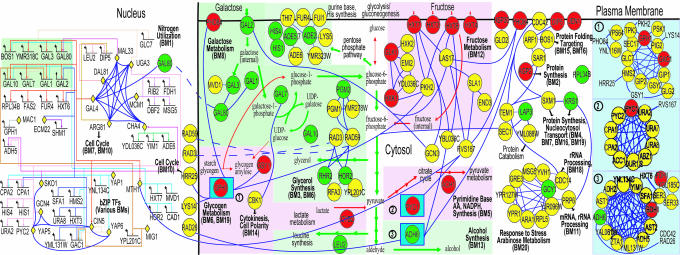
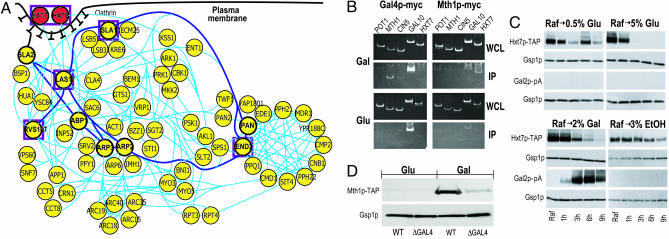
The integration of data from multiple global assays is essential to understanding dynamic spatiotemporal interactions within cells. In a companion paper, we reported a data integration methodology, designated Pointillist, that can handle multiple data types from technologies with different noise characteristics. Here we demonstrate its application to the integration of 18 data sets relating to galactose utilization in yeast. These data include global changes in mRNA and protein abundance, genome-wide protein-DNA interaction data, database information, and computational predictions of protein-DNA and protein-protein interactions. We divided the integration task to determine three network components: key system elements (genes and proteins), protein-protein interactions, and protein-DNA interactions. Results indicate that the reconstructed network efficiently focuses on and recapitulates the known biology of galactose utilization. It also provided new insights, some of which were verified experimentally. The methodology described here, addresses a critical need across all domains of molecular and cell biology, to effectively integrate large and disparate data sets.


Figures

Fig. 1.
Fig. 1.
Data integration framework for network modeling. Five data integration problems are shown: Identification of genes affected by environmental and genetic perturbations (A); PP interactions (B); PD interactions (C); domain-domain interactions (E); and TFBS predictions (F). The data sets used for network modeling to study galactose utilization in yeast are presented for illustration purposes. The label for each box indicates the type of data used. The italic note below the label indicates the statistical measure we used to calculate empirical P values (or significances) for each data set. GE, gene expression; PA, protein abundance; KO, (gene) knockout; PP, protein–protein (interaction); PD, protein–DNA (interaction); TF, transcription factor; TFBS, transcription factor binding site; w, wild type; gal, galactose; raf, raffinose; IP, immunopurification enriched; WCL, whole cell lysate enriched. (D) A set of network analysis tools that helps us explore a complex network systematically. These tools allow us to build a subnetwork that includes PP and PD interactions (edges) pertinent to affected genes/proteins (nodes) and given perturbations, and to identify clusters of proteins in the network (see text).
Fig. 2.
Fig. 2.
Integration results. (A) The final set of selected genes. The colors represent the increase (green), decrease (red), and no change (yellow) after two perturbations (TC stands for time-course and see Fig. 1 legend for the other abbreviations). These selected genes show how metabolic fluxes are redistributed to optimally use galactose from Leloir pathway mainly to alcohol synthesis via glycolysis (Figs. 3 and 6B). (B) Integration results for determination of PP interactions. The detection methods used to identify PP interactions in DIP and the corresponding selection and removal rates by our integration method are shown. Detection method abbreviations are S, small-scale experiments; M, multiple yeast two hybrid assays; R, paralog analysis. Our method selected 99.1% (2,980) of 3,006 interactions detected by small-scale experiments (S), which are generally considered as true PP interactions in DIP (see text). (C) TFBS prediction results for the upstream (putative regulatory) sequence of GAL2, which is reported to have five binding sites for Gal4p. The results for each search algorithm are shown in a separate row. Green bars indicate the averaged score at each position, whereas magenta dots indicate P values from one-tailed t test. The integrated overall P values are shown in the bottom row (magenta bars). The integration method predicted all reported Gal4p binding sites correctly (arrows), and performed better than individual algorithms by effectively summarizing the supportive, complementary, or contradictory nature of the predictions (see text).
Fig. 3.
Fig. 3.
The final network resulting from applications of our integration method to the 18 types of evidence for yeast galactose utilization and a set of network analysis tools. This network model recapitulates many known features of galactose metabolism (e.g., GAL regulon induction; see text). Also, it provides a number of insights into regulatory interactions between different metabolic modules. For example, we note a possible mechanistic explanation of how fructose metabolism (BM12) is down-regulated in galactose: Gal4p contributes to a decrease in fructose uptake by repressing the fructose transporter Hxt7p via Mth1p (see text). The legends for nodes and edges in the network are as follows: (i) TFs in nucleus are represented by yellow diamonds; (ii) all other proteins (circles) are located according to their subcellular localizations (plasma membrane, cytosol, and nucleus); (iii) circle colors represent increase (green), decrease (red), and no significant change (yellow) in expression when the carbon source is changed from raffinose to galactose; (iv) the three numbered squares shown at the right represent complexes; and (v) blue edges represent PP interactions and multicolored edges in the nucleus represent PD interactions. Short colored arrows in the cytosol represent the increase (green) and decrease (red) in pathway fluxes. Biomodules are labeled with BM, and the short black arrows represent communication between the 9 modules selected for this subnetwork and the remaining 11 modules (Fig. 11).
Fig. 4.
Fig. 4.
Theoretical prediction and experimental verification. (A) A subnetwork of proteins related to the galactose-mediated endocytosis and degradation of Hxt6p and Hxt7p. This network provides a detailed view of processes related to vesicle-mediated protein degradation including: (i) endocytosis (SlaI/2p, Myo3/5p, Lsb3/5p, Las17p, Rvs167p, End3p, Ark1p, Prk1p, etc.); (ii) actin cortical patch assembly (Ent1p, Arc15/19p, Hua1p, BspI, etc.); (iii) vesicle movement along actin filament (Act1p); (iv) protein–vacuole transport (Arp6p). Thus, this network not only captures existing models for endocytosis (33), but also hypothesizes additional proteins and their interactions. (B) Chromatin IP showing galactose-specific binding of Gal4p-myc to MTH1, CIN5, and GAL10 (Left) and of Mth1p-myc to HXT7 (Right). Strains with myc-tagged versions of Gal4p or Mth1p were grown in glucose or galactose, cells were lysed, and chromatin was sheered and immunoprecipitated with antibodies to the myc epitope. DNA fragments in IP and whole cell extract (WCE) fractions were amplified by PCR and resolved on acrylamide gels. (C) Western blots assaying the abundances of Hxt7p-TAP, Gal2p-pA, and Gsp1p (loading control) after shifting cells from growth in raffinose to growth in glucose, galactose, or ethanol. Strains with TAP- or pA-tagged versions of Hxt7p or Gal2p, respectively, were grown to mid-logarithmic in rich medium containing 2% raffinose. The cells were harvested and incubated for 9 h in rich medium containing different carbon sources at the indicated concentrations. Whole cell lysates from these cultures were probed with affinity-purified rabbit IgG or anti-Gsp1p, and visualized with anti-rabbit-HRP secondary antibodies and ECL. (D) Wild-type and ΔGAL4 strains containing MTH1-TAP were grown overnight in YEP containing 2% glucose, and then transferred to YEP containing either 2% glucose or 2% galactose and grown for 14 h to mid-log phase. Equal amounts of protein from each culture were separated by SDS/PAGE and analyzed by immunoblotting with antibodies to the TAP tag (Open Biosystems) or to Gsp1p (to monitor protein loads). Levels of Mth1p-TAP increase in the presence of galactose, whereas the levels of Gsp1p remain unchanged. Robust Mth1p-TAP induction depends on GAL4, suggesting that Gal4p is a positive regulator of MTH1.

Similar articles

Cited by

References

    1. Mrowka, R., Patzak, A. & Herzel, H. (2001) Genome Res. 11, 1971–1973. - PubMed
    1. Hwang, D., Rust, A. G., Ramsey, S., Smith, J. J., Leslie, D. M., Weston, A. D., de Atauri, P., Aitchison, J. D., Hood, L., Siegel, A. F. & Bolouri, H. (2005) Proc. Natl. Acad. Sci. USA 102, 17296–17301. - PMC - PubMed
    1. Ideker, T., Thorsson, V., Ranish, J. A., Christmas, R., Buhler, J., Eng, J. K., Bumgarner, R., Goodlett, D. R., Aebersold, R. & Hood, L. (2001) Science 292, 929–934. - PubMed
    1. Prinz, S., Avila-Campillo, I., Aldridge, C., Srinivasan, A., Dimitrov, K., Siegel, A. F. & Galitski, T. (2004) Genome Res. 14, 380–390. - PMC - PubMed
    1. Longtine, M. S., McKenzie, A., Demarini, D. J., Shah, N. G., Wach, A., Brachat, A., Philippsen, P. & Pringle, J. R. (1998) Yeast 14, 953–961. - PubMed

Publication types

Substances