. 2006 Jan 27;281(4):2061-70.
doi: 10.1074/jbc.M507741200. Epub 2005 Nov 22.

Protein kinase A-mediated phosphorylation modulates cytochrome c oxidase function and augments hypoxia and myocardial ischemia-related injury

Affiliations

Protein kinase A-mediated phosphorylation modulates cytochrome c oxidase function and augments hypoxia and myocardial ischemia-related injury

Subbuswamy K Prabu et al. J Biol Chem. .

Abstract

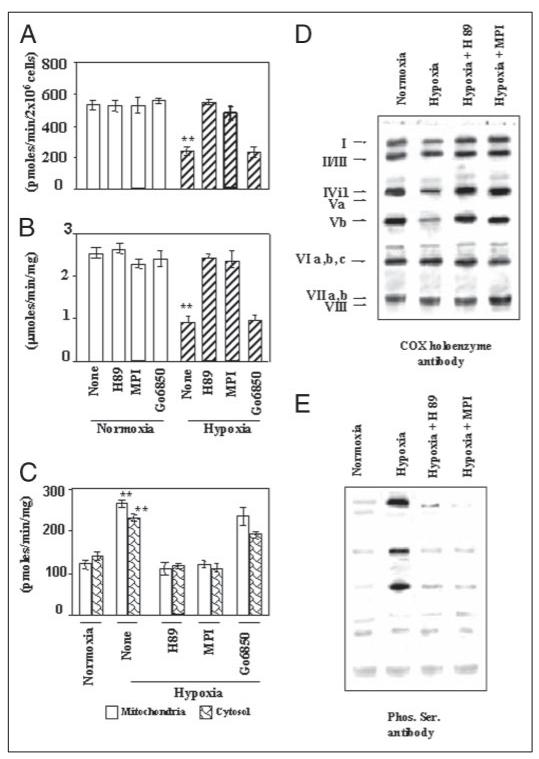
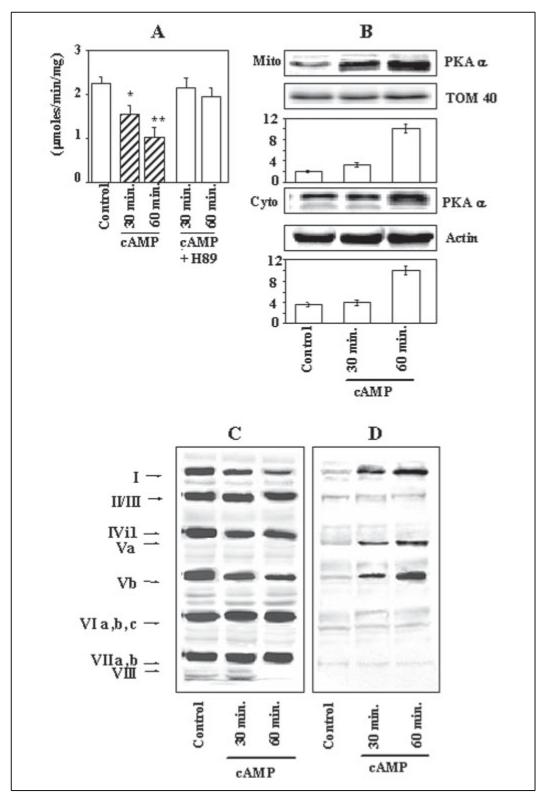
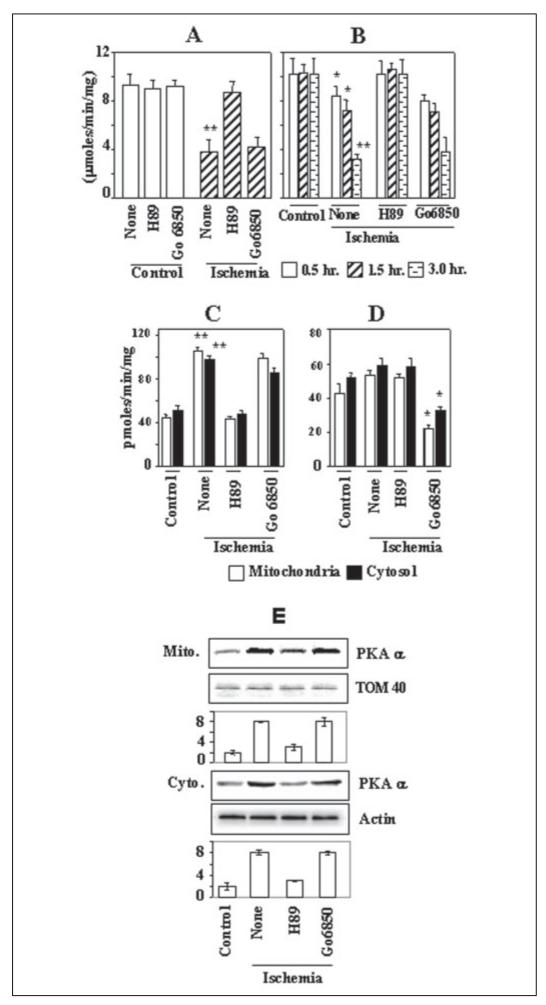
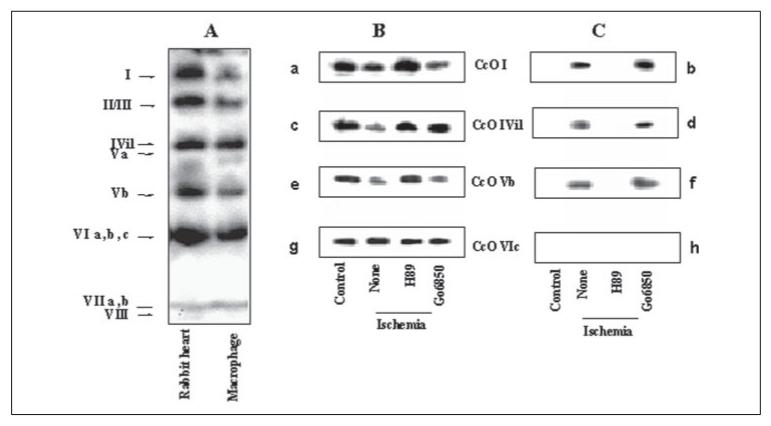
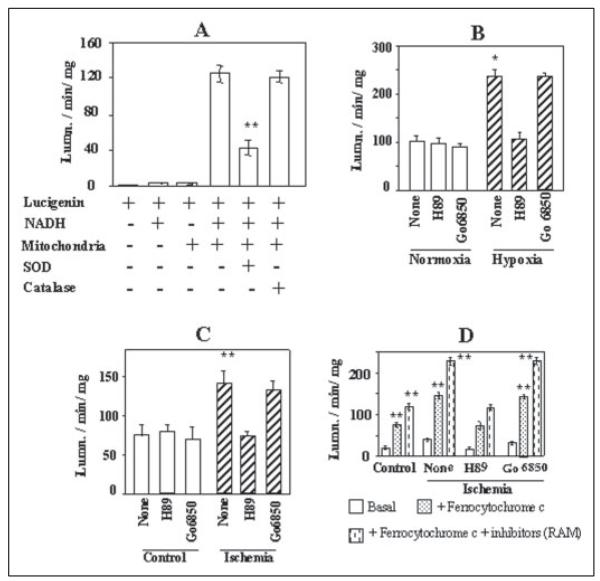
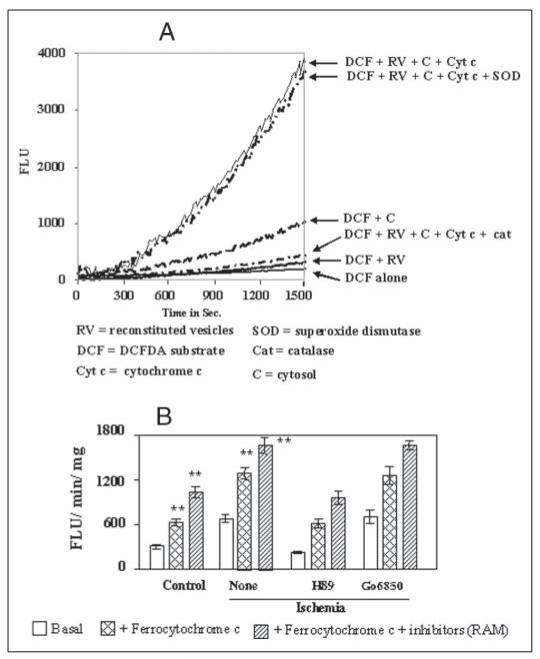
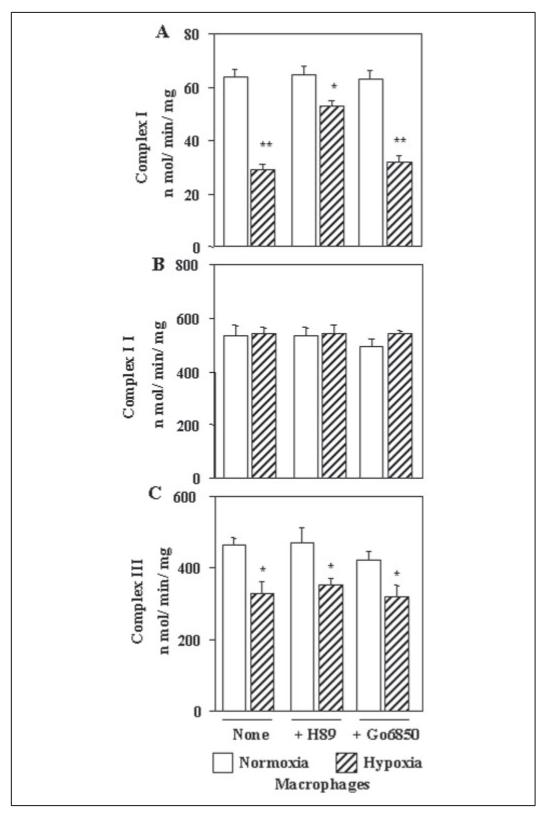
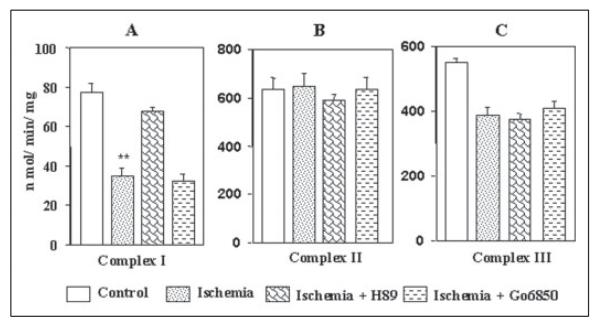
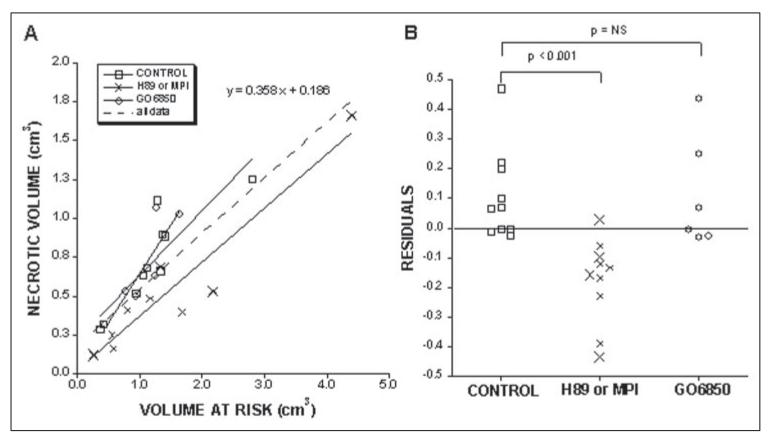
We have investigated the effects of hypoxia and myocardial ischemia/reperfusion on the structure and function of cytochrome c oxidase (CcO). Hypoxia (0.1% O(2) for 10 h) and cAMP-mediated inhibition of CcO activity were accompanied by hyperphosphorylation of subunits I, IVi1, and Vb and markedly increased reactive O(2) species production by the enzyme complex in an in vitro system that uses reduced cytochrome c as an electron donor. Both subunit phosphorylation and enzyme activity were effectively reversed by 50 nm H89 or 50 nm myristoylated peptide inhibitor (MPI), specific inhibitors of protein kinase A, but not by inhibitors of protein kinase C. In rabbit hearts subjected to global and focal ischemia, CcO activity was inhibited in a time-dependent manner and was accompanied by hyperphosphorylation as in hypoxia. Additionally, CcO activity and subunit phosphorylation in the ischemic heart were nearly completely reversed by H89 or MPI added to the perfusion medium. Hyperphosphorylation of subunits I, IVi1, and Vb was accompanied by reduced subunit contents of the immunoprecipitated CcO complex. Most interestingly, both H89 and MPI added to the perfusion medium dramatically reduced the ischemia/reperfusion injury to the myocardial tissue. Our results pointed to an exciting possibility of using CcO activity modulators for controlling myocardial injury associated with ischemia and oxidative stress conditions.


Figures

Figure 1
Figure 1. Inhibition of CcO activity in macrophages during hypoxia and reversal by PKA inhibitors H89 and MPI
RAW 264.7 mouse monocyte macrophages were grown under normoxia or hypoxia (0.1% O2 for 10 h) with or without added H89 or MPI (50 nm each) or 10 nm Go6850 and used for assays. A, CcO activity was measured in permeabilized macrophages grown under normoxia or hypoxia using the DAB method. B, CcO activity was measured spectrophotometrically following the oxidation of cytochrome c in enzyme reconstituted in asolectin-cardiolipin vesicles as described under “Materials and Methods.” C, PKA activity was measured in mitochondria and cytosol from macrophages grown under different conditions. D and E, CcO enzyme from cells grown under different conditions was solubilized in 1.5% sodium cholate and immunoprecipitated with the holoenzyme antibody. Equal amounts of immunoprecipitates were resolved on two companion gels, and the proteins were probed with polyclonal antibody against CcO (D) and antibody to Ser phosphate (E). The conditions for isolation of mitochondria, immunoprecipitation, and immunoblotting were as described under “Materials and Methods.” A–C, the average ± S.D. were calculated from 3 to 4 separate assays. Asterisks indicate significant differences (**, p =<0.01).
Figure 2
Figure 2. cAMP-mediated inhibition of CcO activity and reversal by H89 in murine macrophages
Mitochondria (Mito) and cytosol from macrophages grown in presence or absence of 100 mM dibutyryl cAMP for 30 and 60 min were assayed for CcO activity and used for immunoprecipitation studies. A, CcO activity in reconstituted vesicles was measured as described in Fig. 1. B, the level of PKAα subunit was measured by immunoblot analysis of mitochondrial and cytosolic proteins (30 μg of protein each), and the blots were quantified by imaging through a Bio-Rad VersaDoc imaging system. The band intensities are presented as arbitrary absorbance units. C and D, CcO solubilized from mitochondria in 1.5% sodium cholate was immunoprecipitated and divided into two equal parts. Each part was resolved on two companion gels and subjected to immunoblot analysis with holoenzyme antibody (C) and Ser phosphate antibody (D). A and B, the values represent average ± S.D. of 3-4 independent estimates. Asterisks indicate significant differences (*, p < 0.05; **, p =<0.01).
Figure 3
Figure 3. Inhibition of CcO activity in rabbit hearts subjected to focal or global ischemia
Isolated rabbit hearts were subjected to global ischemia for 20 min (A) or focal ischemia for 0.5-3 h. In some cases 50 nm H89 or 10 nm Go6850 was added in the perfusion medium. At the end of in vitro perfusion and ischemia, tissue was excised, and subcellular fractions were isolated. CcO solubilized from SMP was assayed in reconstituted proteoliposomes as described under “Materials and Methods.” A, CcO activity during 20 min of global ischemia by reduced perfusion flow. B, focal ischemia by coronary occlusion and reperfusion for 0.5, 1.5, and 3.0 h. A and B, CcO activity was measured spectrophotometrically by following oxidation of reduced cytochrome c using enzyme reconstituted in lipid vesicles. C, PKA activity in mitochondria and cytosol; D, PKC activity in mitochondria and cytosol. E, the levels of PKAα subunit in the mitochondrial and cytosolic fractions of heart tissue. Immunoblot in E was carried out with 30 μg of protein in each case. The blots were reprobed with TOM40 antibody or actin antibody as loading controls for the mitochondrial and cytoplasmic proteins, respectively. A–D, the average values ± S.D. were calculated from 4 to 6 independent estimates. Asterisks indicate significant difference (*, p < 0.05; **, p < 0.01). Mito, mitochondria.
Figure 4
Figure 4. Phosphorylation status of CcO subunits from rabbit hearts subjected to global ischemia
A, sodium cholate (1.5%)-solubilized CcO from control macrophages and rabbit hearts was immunoprecipitated with antibody to holoenzyme, and the immunoprecipitates were probed with the same holoenzyme antibody. B, CcO from hearts subjected to 20 min of global ischemia under different conditions was immunoprecipitated as in A, and equal amounts of the immunoprecipitates were probed with subunitspecific antibodies against CcO subunits I, IVi1, Vb and VIc (panels a, c, e, and g) in B, or with antibody against Ser phosphate (panels b, d, f, and h) in C. In each case, heart mitochondrial membranes solubilized with 1.5% sodium cholate (500 μg of protein each) were used for immunoprecipitation as described under “Materials and Methods.”
Figure 5
Figure 5. Rate of production of mitochondrial ROS during hypoxia and ischemia
A and B, digitonin-treated mitochondria from macrophages grown under normoxia or hypoxia were swollen by suspension in 50 mM KH2PO4 buffer and used for the assay.C, swollen mitoplasts from control heart and those subjected to 20 min of global ischemia were used for the assay. D, CcO from hearts subjected to ischemia and reconstituted in asolectin-cardiolipin vesicles were used for assay. ROS production (mostly O.2 radicals)in response to added NADH was measured by the lucigenin method. Ferrocytochrome c (100 μm), RAM inhibitors (2.5–10 μm), NADH (0.5 mM), SOD (30 units/ml), and catalase (10 units/ml) were added at the beginning of reaction before adding 5 mM lucigenin. Assays were run in 200-ml volumes and contained mitoplasts (100–200 μg) or reconstituted lipid vesicles (50–100 μg of protein) as enzyme source. Asterisks indicate significant differences (*, p < 0.05; **, p =<0.01).
Figure 6
Figure 6. Measurement of ROS production by CcO using modified DCF-DA method
A shows the characteristics of the modified DCF-DA method for in vitro assay of peroxy radicals generated by liposome-reconstituted CcO enzyme. The rate of fluorescence emission by reactions with added DCF-DA alone (1 μm), and those with added reconstituted CcO (RV) from control heart mitochondria (100 μg), reduced cytochrome c (100 mM), partially purified cytosolic protein fraction rich in esterase activity (10 μg/ml), catalase (10 units/ml), and SOD (30 units/ml) are shown. B, the rate of fluorescence at the linear range (between 600 and 1400 s from A) was integrated to obtain the fluorescence units/min/mg protein. CcO from control and ischemic hearts reconstituted in lipid vesicles as described under “Materials and Methods” and Fig. 1 were used in the assay. Results in B represent average ± S.D. of four independent assays. Asterisks indicate significant difference (**, p < 0.01).
Figure 7
Figure 7. Activities of other electron transport enzyme complexes in macrophages grown under hypoxic conditions
Mitochondria from cells grown under normoxia or hypoxia were used for assays as described under “Materials and Methods.” A, NADH: ubiquinone oxidoreductase activity (complex I); B, succinate:ubiquinone oxidoreductase activity (complex II); and C, ubiquinol:ferrocytochrome c oxidoreductase activity (complex III). Values represent average ± S.D. of four independent assays. Asterisks indicate significant differences (*, p < 0.05; **, p =<0.01).
Figure 8
Figure 8. Activities of other electron transport enzyme complexes in hearts subjected to global ischemia
Mitochondria from control hearts of those subjected to global ischemia for 20 min were used for assays as described in Fig. 7. Complex I activity (A), complex II activity (B), and complex III activity (C) values represent average ± S.D. of four independent assays. Asterisks indicate significant differences (**, p =<0.01).
Figure 9
Figure 9. The relationship of the necrotic volume to the volume at risk for the three experimental groups (A), and the residuals of the data points from the linear regression line of the pooled data (B)
The second experimental group (H89 or MPI) includes six hearts perfused with H89 (indicated by small ×) and four perfused with a myristoylated peptide inhibitor of PKA (indicated by the large ×). A, the solid lines are the regression lines for the individual groups. The dashed line is the regression line for the pooled data of all the groups. At the top is the equation for this line. B shows the residuals of the data points from this pooled line for each group. They were significantly different by analysis of variance (p < 0.001). The p values in B show the differences between individual groups using a nonpaired t test.

Similar articles

Cited by

References

    1. Chandel N, Budinger GR, Kemp RA, Schumacker PT. Am. J. Physiol. 1995;268:L918–L925. - PubMed
    1. Chandel NS, Schumacker PT. J. Appl. Physiol. 2000;88:1880–1889. - PubMed
    1. Dagsgaard C, Taylor LE, O’Brien KM, Poyton RO. J. Biol. Chem. 2001;276:7593–7601. - PubMed
    1. Merle P, Kadenbach B. Eur. J. Biochem. 1982;125:239–244. - PubMed
    1. Poyton RO, Dagsgaard CJ. Adv. Exp. Med. Biol. 2000;475:177–184. - PubMed

Publication types

MeSH terms

LinkOut - more resources