Clinical Trial
. 2006 Mar 15;107(6):2409-14.
doi: 10.1182/blood-2005-06-2399. Epub 2005 Nov 22.

IL-2 administration increases CD4+ CD25(hi) Foxp3+ regulatory T cells in cancer patients

Affiliations
Clinical Trial

IL-2 administration increases CD4+ CD25(hi) Foxp3+ regulatory T cells in cancer patients

Mojgan Ahmadzadeh et al. Blood. .

Abstract

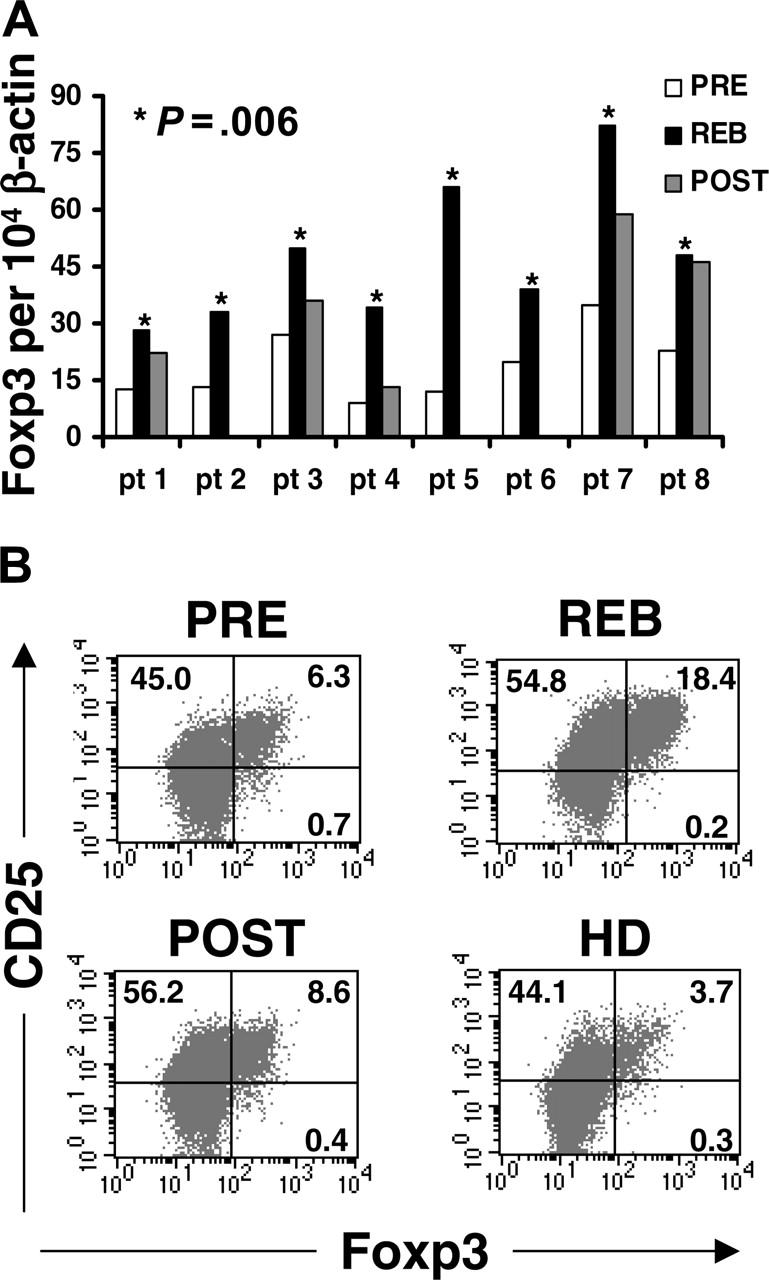
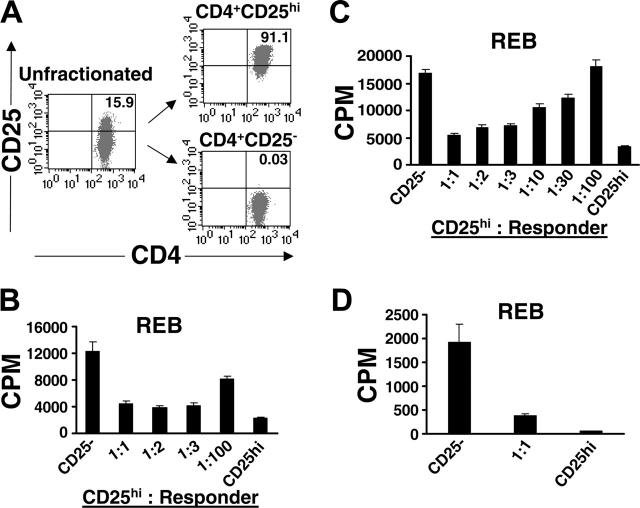
Interleukin-2 (IL-2) is historically known as a T-cell growth factor. Accumulating evidence from knockout mice suggests that IL-2 is crucial for the homeostasis and function of CD4+ CD25+ regulatory T cells in vivo. However, the impact of administered IL-2 in an immune intact host has not been studied in rodents or humans. Here, we studied the impact of IL-2 administration on the frequency and function of human CD4+ CD25(hi) T cells in immune intact patients with melanoma or renal cancer. We found that the frequency of CD4+ CD25(hi) T cells was significantly increased after IL-2 treatment, and these cells expressed phenotypic markers associated with regulatory T cells. In addition, both transcript and protein levels of Foxp3, a transcription factor exclusively expressed on regulatory T cells, were consistently increased in CD4 T cells following IL-2 treatment. Functional analysis of the increased number of CD4+ CD25(hi) T cells revealed that this population exhibited potent suppressive activity in vitro. Collectively, our results demonstrate that administration of high-dose IL-2 increased the frequency of circulating CD4+ CD25(hi) Foxp3+ regulatory T cells. Our findings suggest that selective inhibition of IL-2-mediated enhancement of regulatory T cells may improve the therapeutic effectiveness of IL-2 administration.


Figures

Figure 1.
Figure 1.
Administration of high-dose IL-2 alters lymphocyte counts. (A) Patients received 3 daily doses of high-dose IL-2 as tolerated (total of 7-11 doses per patient). Patients were leukapheresed prior to the start of treatment on day 0 (PRE), during the peak of lymphocytosis or rebound (REB), and about 2 to 3 weeks after therapy (POST), as indicated by the arrows. Absolute lymphocyte counts (ALCs) were measured daily. The percent of CD4+ (B) and CD8+ (C) T cells per CD3+ T-cell population was quantified for 8 patients by staining PBMCs with anti-CD4 and anti-CD3 antibodies. The dot plots were gated on live (propidium idodide negative, PI-) CD3+ T cells. For CD8 T cells, CD3+CD4- T cells were considered as CD8 T cells in some experiments. Each symbol represents one patient. Leukaphereses samples for POST were available only for 5 patients. P values were determined using paired t test and adjusted for multiple comparisons.
Figure 2.
Figure 2.
Induction of CD25 expression by T cells following IL-2 administration. Cryopreserved PBMCs were triple-stained with allophycocyanin-conjugated anti-CD4, PE-conjugated anti-CD25, and FITC-conjugated anti-CD3 antibodies. (A) The dot plots were gated on PI-CD3+ T cells. The gate for CD4+CD25hi T cells was drawn based on the top 4% of CD4+ T cells expressing high levels of CD25 in the peripheral blood of each patient prior to IL-2 therapy (PRE). The same gate was used for rebound and post-treatment samples for each patient. The number represents the percentage of CD4+CD25hi T cells per total CD4 T cells. The gate for CD8+CD25+ (CD4-CD3+) was based on the isotype control antibody, and the number represents the percentage of CD8+CD25+ T cells per total CD8 T cells. The percent induction of CD25 expression of CD4 (B) and CD8 (C) T cells in 8 patients were quantified by using the gate for CD4+CD25hi and for CD8+CD25+ T cells, respectively. To enhance for consistency and accuracy, PBMCs from PRE, REB, and POST for each patient were stained and analyzed at the same time. Leukaphereses samples for POST were available only for 5 patients. Each symbol represents one patient. The P values were calculated using paired t test and adjusted for multiple comparisons.
Figure 3.
Figure 3.
Up-regulation of GITR and CTLA-4 following IL-2 administration. (A) Purified CD4 T cells or PBMCs were stained with allophycocyanin-conjugated anti-CD4, PE-conjugated anti-CD25, and FITC-conjugated anti-CD69, anti-GITR, or (C) anti-CD27 antibodies. Dot plots were gated on CD4+ T cells. (B) Purified CD4 T cells or PBMCs were stained initially with either FITC-conjugated anti-CD4 or anti-CD8 antibodies with allophycocyanin-conjugated anti-CD25 antibody, followed by intracellular staining with PE-conjugated anti-CTLA-4 antibody. The dot plots were gated on CD4+ or CD8+ T cells, respectively. The quadrants for CD69, GITR, CD27, and CTLA-4 were based on the isotype control antibodies as well as T cells that lack expression of these markers. This result is representative of 6 patients and 3 healthy donors.
Figure 4.
Figure 4.
IL-2 increased the frequency of CD4+CD25+Foxp3+ T cells in peripheral blood. (A) RNA was extracted from highly purified CD4 T cells (> 97%-99%) isolated from PBMCs and collected through leukapheresis of 8 patients pretreatment (PRE), during rebound phase (REB), and 2 to 3 weeks after treatment (POST). Foxp3 levels were quantified using real-time RT-PCR and normalized for endogenous β-actin. The P value was calculated using paired t test and adjusted for multiple comparisons. (B) To determine Foxp3 expression per cell, cryopreserved PBMCs from patients or healthy donors were initially stained with allophycocyanin-conjugated anti-CD25, FITC-conjugated anti-CD4 or anti-CD8, and PerCP-conjugated anti-CD3 antibodies, followed by intracellular staining for Foxp3 protein. The dot plots were gated on CD3+CD4+ T cells. The quadrants for Foxp3 were based on the isotype control antibody. This result is representative of 6 patients and 3 healthy donors.
Figure 5.
Figure 5.
CD4+CD25hi T cells from rebound phase were suppressive in vitro. To fractionate CD4+CD25hi and CD4+CD25- T cells, purified CD4 T cells isolated from rebound were stained with anti-CD25 PE and subsequently with anti-PE MicroBeads and isolated over magnetic columns as described in “Patients and methods.” We developed and optimized this procedure to consistently enrich for CD4+CD25hi T cells without FACS sorting. (A) The dot plots were gated on CD3+CD4+ T cells and represent the initial starting CD4 T-cell population (Unfractionated) and the subsequent purified CD4CD25 subsets. The numbers represent the percentage of CD4+CD25hi T cells for each fraction. (B, C) Freshly isolated CD4+CD25- T cells (50 000 cells/well) were cocultured alone (CD25-) or with CD4+CD25hi T cells at different ratios and stimulated with anti-CD3 and irradiated T-depleted PBMCs (250 000 cells/well). Proliferation was assessed by [3H]thymidine incorporation pulsed on day 4 and harvested 18 hours later. The results represent the average [3H]thymidine incorporation (CPM) from 5 replicate wells per culture with calculated standard error of the mean. The P values were calculated using 2-sample t test. (D) CD4 T cells were initially purified from cryopreserved PBMCs collected during rebound from another patient, and stained with PE-conjugated anti-CD25, allophycocyanin-conjugated anti-CD4, and FITC-conjugated anti-CD3 antibodies, and subsequently separated into CD4+CD25hi and CD4+CD25- subsets using FACSVantage DiVa sorter. The result is the mean of [3H]thymidine incorporation in triplicate cultures with standard error of the mean, pulsed on day 6 and harvested 18 hours later.

Similar articles

Cited by

References

    1. Morgan DA, Ruscetti FW, Gallo R. Selective in vitro growth of T lymphocytes from normal human bone marrows. Science. 1976;193: 1007-1008. - PubMed
    1. Rosenberg SA, Yang JC, Topalian SL, et al. Treatment of 283 consecutive patients with metastatic melanoma or renal cell cancer using high-dose bolus interleukin 2. J Am Med Assoc. 1994;271: 907-913. - PubMed
    1. Malek TR, Bayer AL. Tolerance, not immunity, crucially depends on IL-2. Nat Rev Immunol. 2004;4: 665-674. - PubMed
    1. Antony PA, Restifo NP. CD4+CD25+ T regulatory cells, immunotherapy of cancer, and interleukin-2. J Immunother. 2005;28: 120-128. - PMC - PubMed
    1. Antony PA, Piccirillo CA, Akpinarli A, et al. CD8+ T cell immunity against a tumor/self-antigen is augmented by CD4+ T helper cells and hindered by naturally occurring T regulatory cells. J Immunol. 2005;174: 2591-2601. - PMC - PubMed

Publication types