

Stillbirths in the United States, 1981-2000: an age, period, and cohort analysis
- PMID: 16304134
- PMCID: PMC1449509
- DOI: 10.2105/AJPH.2004.043885
Stillbirths in the United States, 1981-2000: an age, period, and cohort analysis
Abstract
Objectives: We examined age, period, and cohort (APC) effects on temporal trends in stillbirths among Black and White women in the United States.
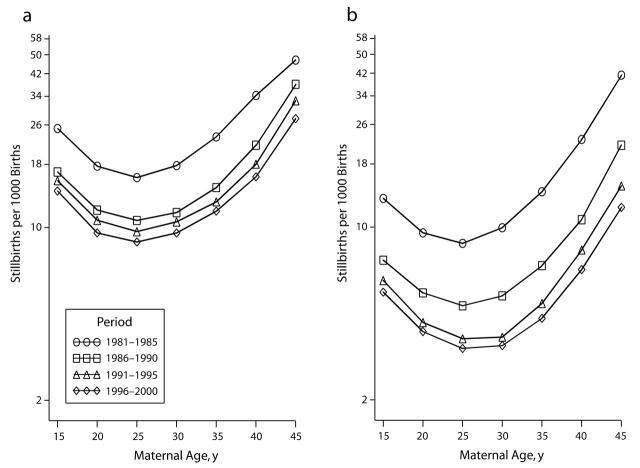
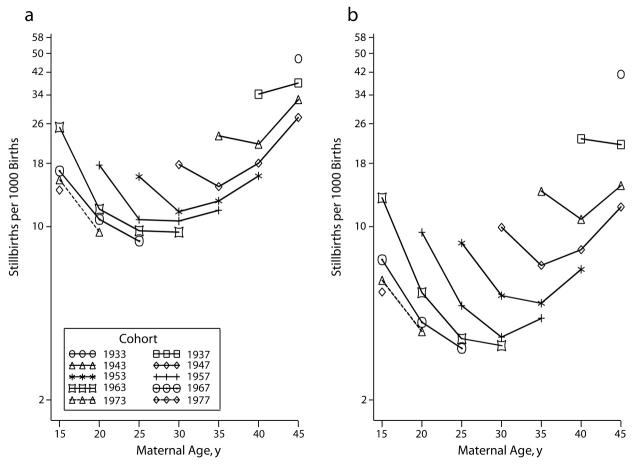
Methods: We conducted a cohort study of Black and White women who delivered a singleton live-born or stillborn infant during 1981 through 2000. We analyzed stillbirth rates at 20 or more weeks of gestation within 7 age groups, 4 periods, and 10 "central" birth cohorts after adjusting for confounders.
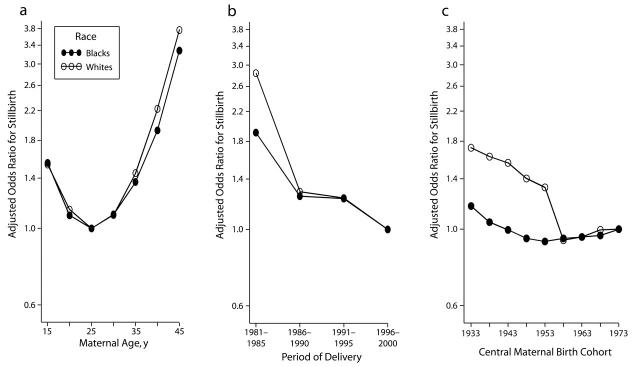
Results: In both racial groups, women younger than 20 years or 35 years or older were at increased risk of stillbirth; risks decreased over successive periods in all age groups. Birth cohort had no impact on stillbirth trends among Blacks and only a small, nonsignificant effect among Whites. Analyses of various APC combinations showed that Blacks were at a 1.2- to 2.9-fold increased risk for stillbirth relative to Whites. Attributable fractions for stillbirth because of age, period, and cohort effects were 16.5%, 24.9%, and 0.1%, respectively, among Black women and 14.5%, 36.2%, and 2.1%, respectively, among White women.
Conclusions: Strong effects of age and period were observed in stillbirth trends, but these factors do not explain the persistent stillbirth disparity between Black and White women.
Figures
References
-
- Martin JA, Hoyert DL. The national fetal death file. Semin Perinatol. 2002;26:3–11. - PubMed
-
- Hsieh HL, Lee KS, Khoshnood B, Herschel M. Fetal death rate in the United States, 1979–1990: trend and racial disparity. Obstet Gynecol. 1997;89:33–39. - PubMed
-
- Raymond EG, Cnattingius S, Kiely JL. Effects of maternal age, parity, and smoking on the risk of stillbirth. Br J Obstet Gynaecol. 1994;101:301–306. - PubMed
-
- Fretts RC, Boyd ME, Usher RH, Usher HA. The changing pattern of fetal death, 1961–1988. Obstet Gynecol. 1992;79:35–39. - PubMed
-
- Skjaerven R, Wilcox AJ, Lie RT, Irgens LM. Selective fertility and the distortion of perinatal mortality. Am J Epidemiol. 1988;128:1352–1363. - PubMed
MeSH terms
LinkOut - more resources
Full Text Sources
Medical
