Clinical Trial
. 2005 Dec;49(12):4903-10.
doi: 10.1128/AAC.49.12.4903-4910.2005.

Interaction of ritonavir-boosted tipranavir with loperamide does not result in loperamide-associated neurologic side effects in healthy volunteers

Affiliations
Clinical Trial

Interaction of ritonavir-boosted tipranavir with loperamide does not result in loperamide-associated neurologic side effects in healthy volunteers

Geoffrey Mukwaya et al. Antimicrob Agents Chemother. 2005 Dec.

Abstract

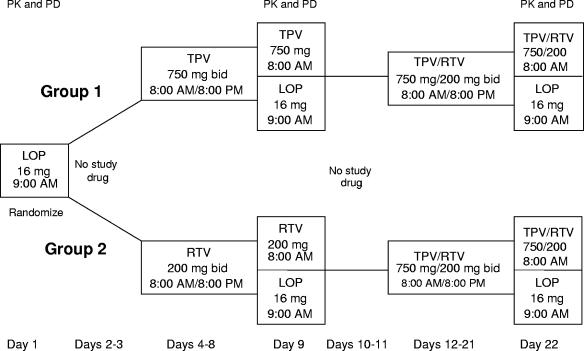
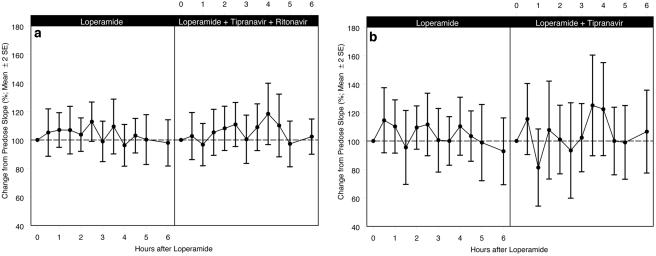
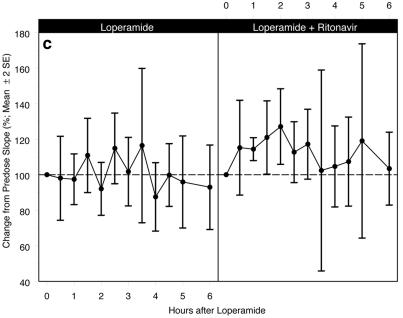
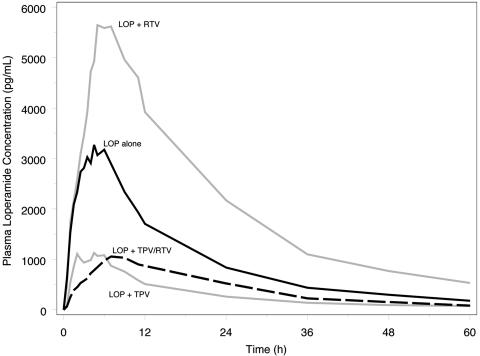
Loperamide (LOP) is a peripherally acting opioid receptor agonist used for the management of chronic diarrhea through the reduction of gut motility. The lack of central opioid effects is partly due to the efflux activity of the multidrug resistance transporter P-glycoprotein (P-gp) at the blood-brain barrier. The protease inhibitors are substrates for P-gp and have the potential to cause increased LOP levels in the brain. Because protease inhibitors, including tipranavir (TPV), are often associated with diarrhea, they are commonly used in combination with LOP. The level of respiratory depression, the level of pupil constriction, the pharmacokinetics, and the safety of LOP alone compared with those of LOP-ritonavir (RTV), LOP-TPV, and LOP-TPV-RTV were evaluated in a randomized, open-label, parallel-group study with 24 healthy human immunodeficiency virus type 1-negative adults. Respiratory depression was assessed by determination of the ventilatory response to carbon dioxide. Tipranavir-containing regimens (LOP-TPV and LOP-TPV-RTV) caused decreases in the area under the concentration-time curve from time zero to infinity for LOP (51% and 63% decreases, respectively) and its metabolite (72% and 77% decreases, respectively), whereas RTV caused increases in the levels of exposure of LOP (121% increase) and its metabolite (44% increase). In vitro and in vivo data suggest that TPV is a substrate for and an inducer of P-gp activity. The respiratory response to LOP in combination with TPV and/or RTV was not different from that to LOP alone. There was no evidence that LOP had opioid effects in the central nervous system, as measured indirectly by CO2 response curves and pupillary response in the presence of TPV and/or RTV.


Figures

FIG. 1.
FIG. 1.
Study design and timeline.
FIG. 2.
FIG. 2.
(a) Mean percent baseline ventilatory slope (±2 SEMs) for LOP alone (n = 20) compared with that for LOP-TPV-RTV treatment (n = 20); AUC0-6 (±SEM) for the percent baseline VE-pETCO2 response slope profile was not statistically significantly different from that observed for LOP alone (633.0 ± 38.6 versus 622.4 ± 31.4 baseline slope · h; P = 0.84); (b) mean percent baseline ventilatory slope (±2 SEMs) for LOP alone (n = 10) compared with that for LOP-TPV treatment (n = 10); AUC0-6 (±SEM) for the percent baseline VE-pETCO2 response slope profile was not statistically significantly different from that observed for LOP alone (633.6 ± 59.5 versus 623.6 ± 48.5 baseline slope · h; P = 0.84); (c) mean percent baseline ventilatory slope (±2 SEMs) for LOP alone (n = 10) compared with that for LOP-RTV treatment (n = 9); AUC0-6 (±SEM) for the percent baseline VE-pETCO2 response slope profile was not statistically significantly different from that observed for LOP alone (687.8 ± 59.2 versus 621.2 ± 45.1 baseline slope · h; P = 0.21).
FIG. 2.
FIG. 2.
(a) Mean percent baseline ventilatory slope (±2 SEMs) for LOP alone (n = 20) compared with that for LOP-TPV-RTV treatment (n = 20); AUC0-6 (±SEM) for the percent baseline VE-pETCO2 response slope profile was not statistically significantly different from that observed for LOP alone (633.0 ± 38.6 versus 622.4 ± 31.4 baseline slope · h; P = 0.84); (b) mean percent baseline ventilatory slope (±2 SEMs) for LOP alone (n = 10) compared with that for LOP-TPV treatment (n = 10); AUC0-6 (±SEM) for the percent baseline VE-pETCO2 response slope profile was not statistically significantly different from that observed for LOP alone (633.6 ± 59.5 versus 623.6 ± 48.5 baseline slope · h; P = 0.84); (c) mean percent baseline ventilatory slope (±2 SEMs) for LOP alone (n = 10) compared with that for LOP-RTV treatment (n = 9); AUC0-6 (±SEM) for the percent baseline VE-pETCO2 response slope profile was not statistically significantly different from that observed for LOP alone (687.8 ± 59.2 versus 621.2 ± 45.1 baseline slope · h; P = 0.21).
FIG. 3.
FIG. 3.
Geometric mean plasma loperamide concentrations alone (n = 24) and in the presence of RTV (n = 11), TPV (n = 12), and TPV-RTV (n = 24), demonstrating that RTV increases LOP concentrations during coadministration, while TPV and TPV-RTV decrease LOP concentrations during coadministration.

References

    1. Back, N. K., A. van Wijk, D. Remmerswaal, M. van Monfort, M. Nijhuis, R. Schuurman, and C. A. Boucher. 2000. In-vitro tipranavir susceptibility of HIV-1 isolates with reduced susceptibility of other protease inhibitors. AIDS 14:101-102. - PubMed
    1. Bourke, D. L., and A. Warley. 1989. The steady-state and rebreathing methods compared during morphine administration in humans. J. Physiol. 419:509-517. - PMC - PubMed
    1. Chong, K. T., and P. J. Pagano. 1997. In vitro combination of PNU-140690, a human immunodeficiency virus type 1 protease inhibitor, with ritonavir against ritonavir-sensitive and -resistant clinical isolates. Antimicrob. Agents Chemother. 41:2367-2373. - PMC - PubMed
    1. Drewe, J., H. Gutmann, G. Fricker, M. Torok, C. Belinger, and J. Huwyler. 1999. HIV protease inhibitor ritonavir: a more potent inhibitor of P-glycoprotein than the cyclosporine analog SDZ PSC 833. Biochem. Pharmacol. 57:1147-1152. - PubMed
    1. Eagling, V. A., D. J. Back, and M. G. Barry. 1997. Differential inhibition of cytochrome P450 isoforms by the protease inhibitors, ritonavir, saquinavir and indinavir. Br J. Clin. Pharmacol. 44:190-194. - PMC - PubMed

Publication types