. 2005 Dec;139(4):1717-35.
doi: 10.1104/pp.105.071662. Epub 2005 Nov 23.

Role of salicylic acid and fatty acid desaturation pathways in ssi2-mediated signaling

Affiliations

Role of salicylic acid and fatty acid desaturation pathways in ssi2-mediated signaling

Pradeep Kachroo et al. Plant Physiol. 2005 Dec.

Abstract

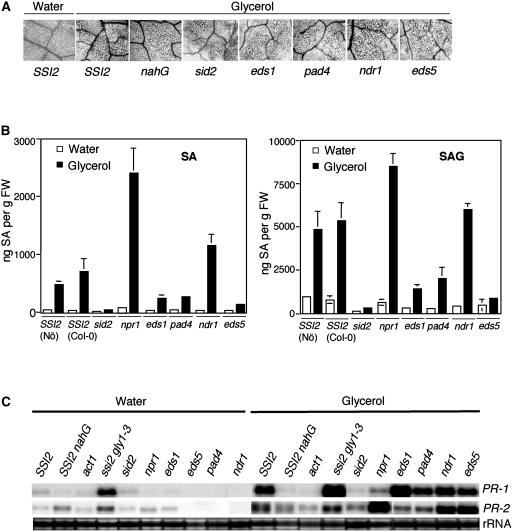
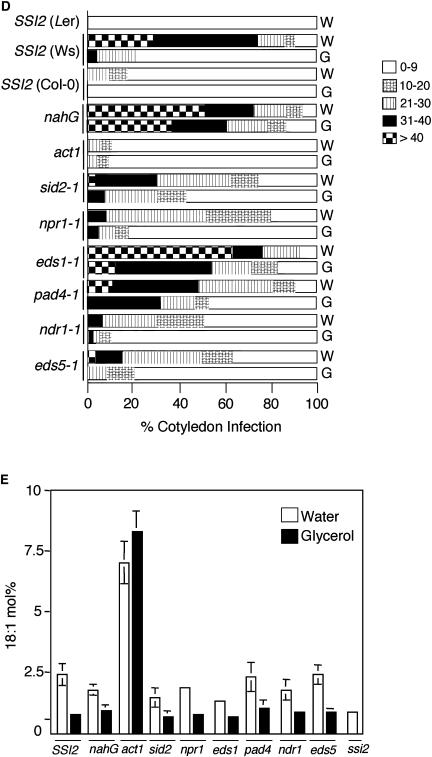
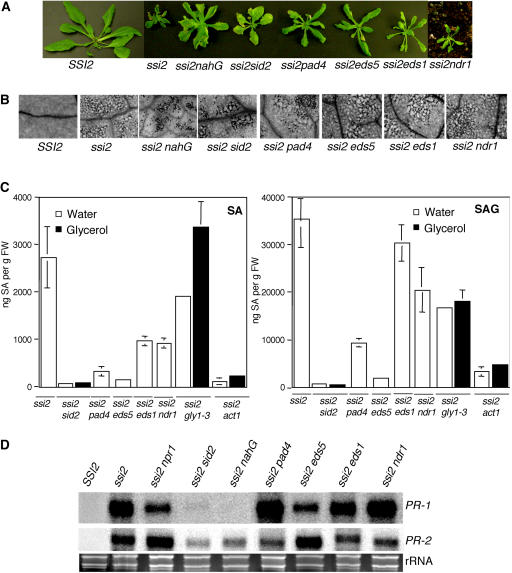
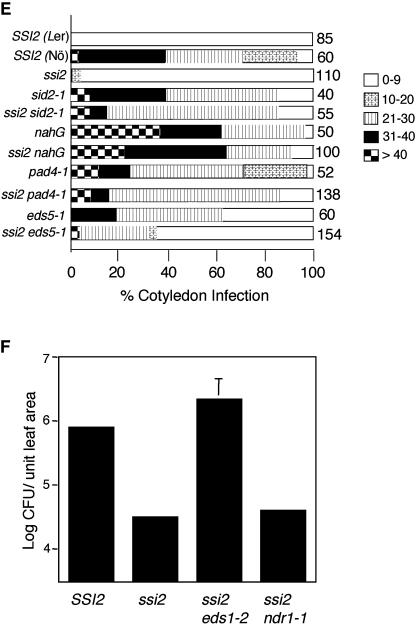
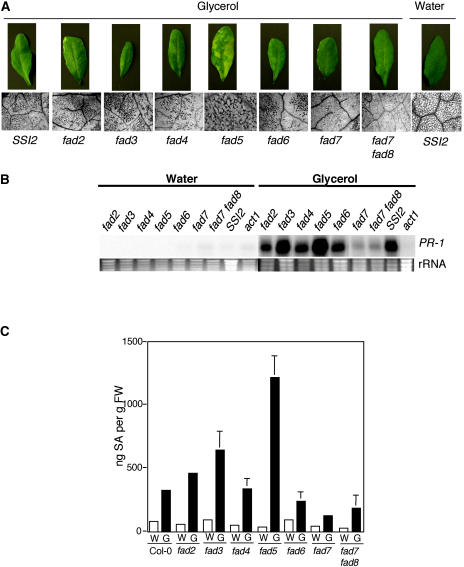
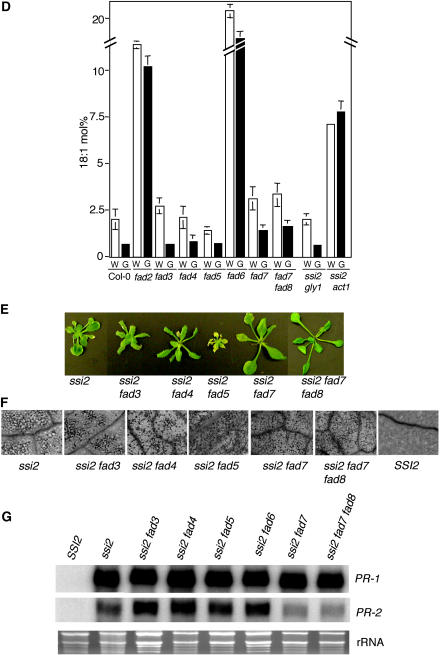
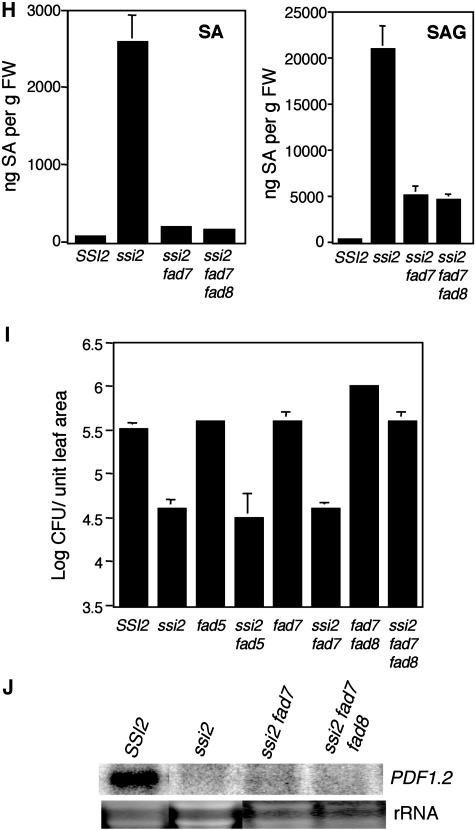
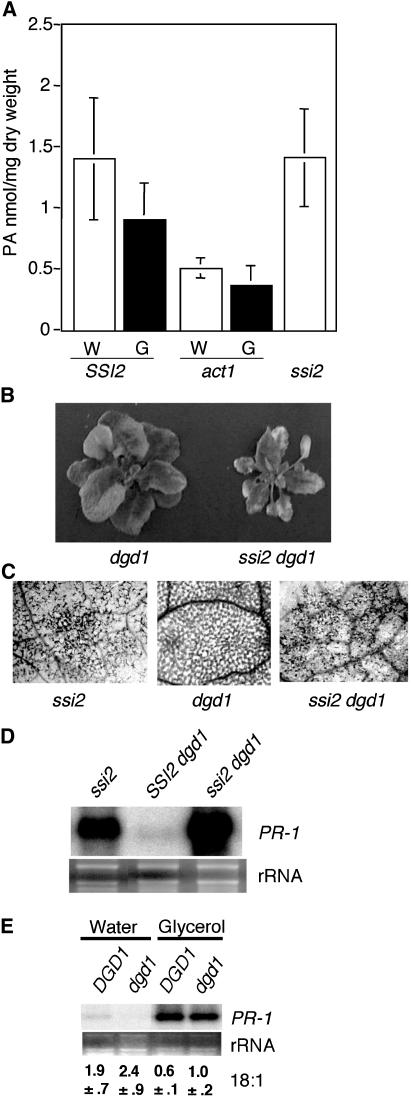
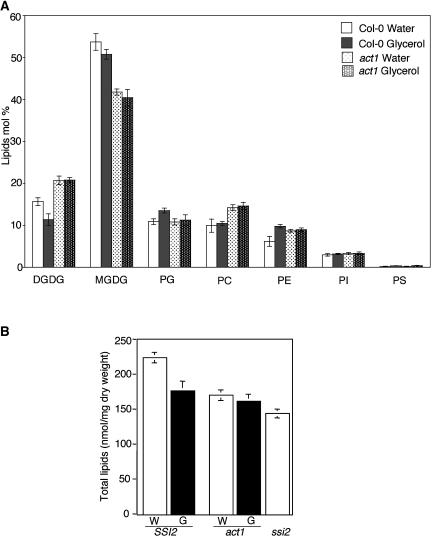
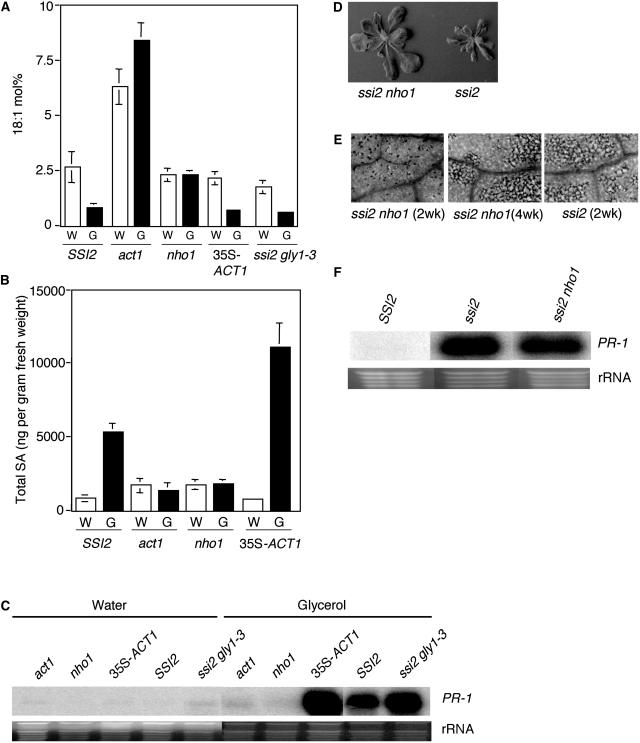
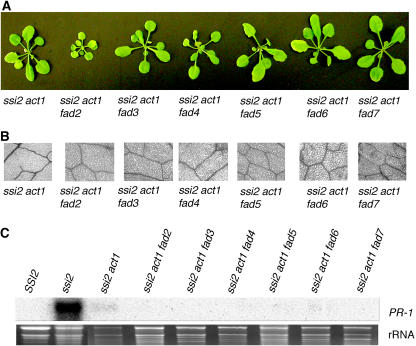
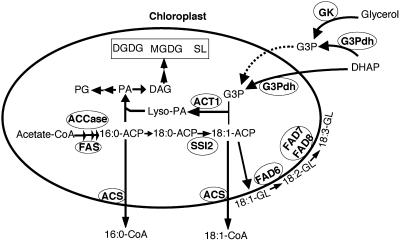
Stearoyl-acyl carrier protein desaturase-mediated conversion of stearic acid to oleic acid (18:1) is the key step that regulates the levels of unsaturated fatty acids (FAs) in cells. Our previous work with the Arabidopsis (Arabidopsis thaliana) ssi2/fab2 mutant and its suppressors demonstrated that a balance between glycerol-3-phosphate (G3P) and 18:1 levels is critical for the regulation of salicylic acid (SA)- and jasmonic acid-mediated defense signaling in the plant. In this study, we have evaluated the role of various genes that have an impact on SA, resistance gene-mediated, or FA desaturation (FAD) pathways on ssi2-mediated signaling. We show that ssi2-triggered resistance is dependent on EDS1, PAD4, EDS5, SID2, and FAD7 FAD8 genes. However, ssi2-triggered defects in the jasmonic acid pathway, morphology, and cell death phenotypes are independent of the EDS1, EDS5, PAD4, NDR1, SID2, FAD3, FAD4, FAD5, DGD1, FAD7, and FAD7 FAD8 genes. Furthermore, the act1-mediated rescue of ssi2 phenotypes is also independent of the FAD2, FAD3, FAD4, FAD5, FAD7, and DGD1 genes. Since exogenous application of glycerol converts wild-type plants into ssi2 mimics, we also studied the effect of exogenous application of glycerol on mutants impaired in resistance-gene signaling, SA, or fad pathways. Glycerol increased SA levels and induced pathogenesis-related gene expression in all but sid2, nahG, fad7, and fad7 fad8 plants. Furthermore, glycerol-induced phenotypes in various mutant lines correlate with a concomitant reduction in 18:1 levels. Inability to convert glycerol into G3P due to a mutation in the nho1-encoded glycerol kinase renders plants tolerant to glycerol and unable to induce the SA-dependent pathway. A reduction in the NHO1-derived G3P pool also results in a partial age-dependent rescue of the ssi2 morphological and cell death phenotypes in the ssi2 nho1 plants. The glycerol-mediated induction of defense was not associated with any major changes in the lipid profile and/or levels of phosphatidic acid. Taken together, our results suggest that glycerol application and the ssi2 mutation in various mutant backgrounds produce similar effects and that restoration of ssi2 phenotypes is not associated with the further desaturation of 18:1 to linoleic or linolenic acids in plastidal or extraplastidal lipids.


Figures

Figure 1.
Figure 1.
Glycerol-mediated effects on mutants impaired in SA or R gene signaling. A, Microscopy of trypan blue-stained leaves from indicated genotypes treated with water or 50 mm glycerol. SSI2 indicates Col-0 ecotype. B, Endogenous SA and SAG levels in the leaves of indicated 4-week-old soil-grown plants treated with water or glycerol. The values are presented as the mean of three replicates. Error bars represent sd. C, Expression of the PR-1 and PR-2 genes in indicated genotypes. RNA gel-blot analysis was performed on 7 μg of total RNA extracted from 4-week-old soil-grown plants treated with water or glycerol. SSI2 indicates Col-0 ecotype. Ethidium bromide staining of rRNA was used as a loading control. D, Growth of P. parasitica biotype Emco5 on various plant genotypes listed at the left. The Ler and Ws ecotypes were used as the resistant and susceptible controls, respectively. The plants were treated with water (W) or glycerol (G) for 72 h prior to pathogen inoculation and approximately 60 to 75 cotyledons were scored for infection. The shade of each box indicates the severity of infection, based on the number of sporangiophores per cotyledon (see key at the right). Except eds1-1 (Ws background) and nahG (Nö background), all other mutant lines were in Col-0 background. E, Glycerol-induced changes in the 18:1 levels in leaf tissue of 4-week-old plants. Plants were treated with glycerol or water, and samples taken 72 h post treatment were analyzed for FAs using gas chromatography (GC). SSI2 indicates Col-0 ecotype. The values are presented as the mean of six to eight replicates. Error bars represent sd.
Figure 1.
Figure 1.
Glycerol-mediated effects on mutants impaired in SA or R gene signaling. A, Microscopy of trypan blue-stained leaves from indicated genotypes treated with water or 50 mm glycerol. SSI2 indicates Col-0 ecotype. B, Endogenous SA and SAG levels in the leaves of indicated 4-week-old soil-grown plants treated with water or glycerol. The values are presented as the mean of three replicates. Error bars represent sd. C, Expression of the PR-1 and PR-2 genes in indicated genotypes. RNA gel-blot analysis was performed on 7 μg of total RNA extracted from 4-week-old soil-grown plants treated with water or glycerol. SSI2 indicates Col-0 ecotype. Ethidium bromide staining of rRNA was used as a loading control. D, Growth of P. parasitica biotype Emco5 on various plant genotypes listed at the left. The Ler and Ws ecotypes were used as the resistant and susceptible controls, respectively. The plants were treated with water (W) or glycerol (G) for 72 h prior to pathogen inoculation and approximately 60 to 75 cotyledons were scored for infection. The shade of each box indicates the severity of infection, based on the number of sporangiophores per cotyledon (see key at the right). Except eds1-1 (Ws background) and nahG (Nö background), all other mutant lines were in Col-0 background. E, Glycerol-induced changes in the 18:1 levels in leaf tissue of 4-week-old plants. Plants were treated with glycerol or water, and samples taken 72 h post treatment were analyzed for FAs using gas chromatography (GC). SSI2 indicates Col-0 ecotype. The values are presented as the mean of six to eight replicates. Error bars represent sd.
Figure 2.
Figure 2.
Morphological, molecular, and biochemical phenotypes of wild-type, ssi2, ssi2 nahG, ssi2 sid2, ssi2 pad4, ssi2 eds1, ssi2 eds5, and ssi2 ndr1 plants. A, Comparison of the morphological phenotypes displayed by the wild-type (SSI2, Nö ecotype), ssi2, and various double-mutant plants in the ssi2 background. B, Microscopy of trypan blue-stained leaves from wild-type (SSI2, Nö ecotype), ssi2, and various double-mutant plants in the ssi2 background. C, Endogenous SA and SAG levels in the leaves of indicated 4-week-old soil-grown plants treated with water or glycerol. The values are presented as the mean of three replicates. Error bars represent sd. D, Expression of the PR-1 and PR-2 genes in indicated genotypes. RNA gel-blot analysis was performed on 7 μg of total RNA extracted from 4-week-old soil-grown plants. SSI2 indicates Nö ecotype. Ethidium bromide staining of rRNA was used as a loading control. E, Growth of P. parasitica biotype Emco5 on various plant genotypes listed at the left. The Ler and Nö ecotypes were used as the resistant and susceptible controls, respectively. The numbers against each box indicate cotyledons scored. The shade of each box indicates the severity of infection, based on the number of sporangiophores per cotyledon (see key at the right). F, Growth of P. syringae on SSI2, ssi2, ssi2 eds1, and ssi2 ndr1. Four leaf discs were harvested from infected leaves at 3 d postinoculation, ground in 10 mm MgCl2, and the bacterial numbers tittered. The bacterial numbers ± sd (n = 4) presented as colony forming units (CFU) per unit leaf area of 25 mm2. The experiment was independently performed twice with similar results.
Figure 2.
Figure 2.
Morphological, molecular, and biochemical phenotypes of wild-type, ssi2, ssi2 nahG, ssi2 sid2, ssi2 pad4, ssi2 eds1, ssi2 eds5, and ssi2 ndr1 plants. A, Comparison of the morphological phenotypes displayed by the wild-type (SSI2, Nö ecotype), ssi2, and various double-mutant plants in the ssi2 background. B, Microscopy of trypan blue-stained leaves from wild-type (SSI2, Nö ecotype), ssi2, and various double-mutant plants in the ssi2 background. C, Endogenous SA and SAG levels in the leaves of indicated 4-week-old soil-grown plants treated with water or glycerol. The values are presented as the mean of three replicates. Error bars represent sd. D, Expression of the PR-1 and PR-2 genes in indicated genotypes. RNA gel-blot analysis was performed on 7 μg of total RNA extracted from 4-week-old soil-grown plants. SSI2 indicates Nö ecotype. Ethidium bromide staining of rRNA was used as a loading control. E, Growth of P. parasitica biotype Emco5 on various plant genotypes listed at the left. The Ler and Nö ecotypes were used as the resistant and susceptible controls, respectively. The numbers against each box indicate cotyledons scored. The shade of each box indicates the severity of infection, based on the number of sporangiophores per cotyledon (see key at the right). F, Growth of P. syringae on SSI2, ssi2, ssi2 eds1, and ssi2 ndr1. Four leaf discs were harvested from infected leaves at 3 d postinoculation, ground in 10 mm MgCl2, and the bacterial numbers tittered. The bacterial numbers ± sd (n = 4) presented as colony forming units (CFU) per unit leaf area of 25 mm2. The experiment was independently performed twice with similar results.
Figure 3.
Figure 3.
Glycerol-mediated effects on mutants impaired in various FAD steps and double-mutant analysis of ssi2 in different fad backgrounds. A, Comparison of the morphological and cell death phenotypes displayed by the wild-type (SSI2, Col-0 ecotype), fad2, fad3, fad4, fad5, fad6, fad7, and fad7 fad8 plants. The plants were treated with water or glycerol and photographed 3 d post treatment. B, Expression of the PR-1 gene in water- and glycerol-treated fads, wild-type (SSI2, Col-0 ecotype), and act1 plants. RNA gel-blot analysis was performed on 7 μg of total RNA extracted from 4-week-old soil-grown plants. Ethidium bromide staining of rRNA was used as a loading control. C, Endogenous SA levels in the leaves of 4-week-old soil-grown wild-type (Col-0), fad2, fad3, fad4, fad5, fad6, fad7, and fad7 fad8 plants treated with water (W) or glycerol (G). The values are presented as the mean of three replicates. Error bars represent sd. D, Glycerol-induced changes in the 18:1 levels in leaf tissue of 4-week-old plants. The ssi2 gly1 and ssi2 act1 plants were used as controls. Plants were treated with glycerol (G) or water (W), and samples taken 72 h post treatment were analyzed for FAs using GC. The values are presented as the mean of six to eight replicates. Error bars represent sd. E, Comparison of the morphological phenotypes displayed by the ssi2 and various ssi2 fad double- and triple-mutant plants. F, Microscopy of trypan blue-stained leaves from ssi2 and various ssi2 fad double- and triple-mutant plants. G, Expression of the PR-1 and PR-2 genes in wild-type (SSI2, Nö ecotype), ssi2, and various ssi2 fad double- and triple-mutant plants. RNA gel-blot analysis was performed on 7 μg of total RNA extracted from 4-week-old soil-grown plants. Ethidium bromide staining of rRNA was used as a loading control. H, Endogenous SA and SAG levels in the leaves of 4-week-old soil-grown SSI2 (Col-0), ssi2, ssi2 fad7, and ssi2 fad7 fad8 plants. Values are presented as the mean of three replicates. Error bars represent sd. I, Growth of P. syringae on SSI2, ssi2, fad5, ssi2 fad5, fad7, ssi2 fad7, fad7 fad8, and ssi2 fad7 fad8. Four leaf discs were harvested from infected leaves at 3 d postinoculation, ground in 10 mm MgCl2, and the bacterial numbers tittered. The bacterial numbers ± sd (n = 4) presented as colony forming units (CFU) per unit leaf area of 25 mm2. The experiment was independently performed twice with similar results. J, Expression of the PDF1.2 gene in SSI2, ssi2, ssi2 fad7, and ssi2 fad7 fad8 plants in response to 50 μm JA. Samples were harvested 48 h post treatment and analyzed by RNA gel-blot analysis performed on 7 μg of total RNA. Ethidium bromide staining of rRNA was used as a loading control.
Figure 3.
Figure 3.
Glycerol-mediated effects on mutants impaired in various FAD steps and double-mutant analysis of ssi2 in different fad backgrounds. A, Comparison of the morphological and cell death phenotypes displayed by the wild-type (SSI2, Col-0 ecotype), fad2, fad3, fad4, fad5, fad6, fad7, and fad7 fad8 plants. The plants were treated with water or glycerol and photographed 3 d post treatment. B, Expression of the PR-1 gene in water- and glycerol-treated fads, wild-type (SSI2, Col-0 ecotype), and act1 plants. RNA gel-blot analysis was performed on 7 μg of total RNA extracted from 4-week-old soil-grown plants. Ethidium bromide staining of rRNA was used as a loading control. C, Endogenous SA levels in the leaves of 4-week-old soil-grown wild-type (Col-0), fad2, fad3, fad4, fad5, fad6, fad7, and fad7 fad8 plants treated with water (W) or glycerol (G). The values are presented as the mean of three replicates. Error bars represent sd. D, Glycerol-induced changes in the 18:1 levels in leaf tissue of 4-week-old plants. The ssi2 gly1 and ssi2 act1 plants were used as controls. Plants were treated with glycerol (G) or water (W), and samples taken 72 h post treatment were analyzed for FAs using GC. The values are presented as the mean of six to eight replicates. Error bars represent sd. E, Comparison of the morphological phenotypes displayed by the ssi2 and various ssi2 fad double- and triple-mutant plants. F, Microscopy of trypan blue-stained leaves from ssi2 and various ssi2 fad double- and triple-mutant plants. G, Expression of the PR-1 and PR-2 genes in wild-type (SSI2, Nö ecotype), ssi2, and various ssi2 fad double- and triple-mutant plants. RNA gel-blot analysis was performed on 7 μg of total RNA extracted from 4-week-old soil-grown plants. Ethidium bromide staining of rRNA was used as a loading control. H, Endogenous SA and SAG levels in the leaves of 4-week-old soil-grown SSI2 (Col-0), ssi2, ssi2 fad7, and ssi2 fad7 fad8 plants. Values are presented as the mean of three replicates. Error bars represent sd. I, Growth of P. syringae on SSI2, ssi2, fad5, ssi2 fad5, fad7, ssi2 fad7, fad7 fad8, and ssi2 fad7 fad8. Four leaf discs were harvested from infected leaves at 3 d postinoculation, ground in 10 mm MgCl2, and the bacterial numbers tittered. The bacterial numbers ± sd (n = 4) presented as colony forming units (CFU) per unit leaf area of 25 mm2. The experiment was independently performed twice with similar results. J, Expression of the PDF1.2 gene in SSI2, ssi2, ssi2 fad7, and ssi2 fad7 fad8 plants in response to 50 μm JA. Samples were harvested 48 h post treatment and analyzed by RNA gel-blot analysis performed on 7 μg of total RNA. Ethidium bromide staining of rRNA was used as a loading control.
Figure 4.
Figure 4.
PA levels and morphological and molecular analyses of ssi2 dgd1 plants. A, PA levels in ssi2 and wild-type (Col-0) and act1 plants treated with water (W) or glycerol (G). The values are presented as the mean of five replicates. Error bars represent sd. According to Student's t test, the difference in PA levels in water- and glycerol-treated samples was not significant (P < 0.05). B, Comparison of the morphological phenotypes displayed by the 4-week-old soil-grown dgd1 and ssi2 dgd1 plants. C, Microscopy of trypan blue-stained leaves from ssi2, dgd1, and ssi2 dgd1 plants. D, Expression of the PR-1 gene in ssi2, dgd1, and ssi2 dgd1 plants. RNA gel-blot analysis was performed on 7 μg of total RNA extracted from 4-week-old soil-grown plants. Ethidium bromide staining of rRNA was used as a loading control. E, Expression of the PR-1 gene and 18:1 levels in water- and glycerol-treated DGD1 (Col-0 ecotype) and dgd1 plants. RNA gel-blot analysis was performed on 7 μg of total RNA extracted from 4-week-old soil-grown plants. Ethidium bromide staining of rRNA was used as a loading control. The 18:1 levels are described as mol% and the values shown are the average of six replicates (±sd).
Figure 5.
Figure 5.
Lipid profile and total lipid content. A, Profile of total lipids extracted from Col-0 and act1 plants treated with water or glycerol. The values are presented as the mean of five replicates. Error bars represent sd. PC, Phosphatidylcholine; PI, phosphatidylinositol; PS, phosphatidylserine. B, Comparison of total lipid content in water- and glycerol-treated SSI2 (Col-0) and act1 plants with that of ssi2. The values are presented as the mean of five replicates. Error bars represent sd.
Figure 6.
Figure 6.
Comparison of glycerol-responsiveness in wild-type, act1, nho1, ssi2 gly1-3, and 35S-ACT1 plants and double-mutant analysis of ssi2 nho1 plants. A, Glycerol-induced changes in the 18:1 levels in leaf tissue of 4-week-old plants. Plants were treated with glycerol (G) or water (W) and samples taken 72 h post treatment were analyzed for 18:1 content using GC. The values shown are an average of six independent replicates. Error bars represent sd. B, Endogenous SA levels in the leaves of 4-week-old soil-grown plants. SSI2 indicates Col-0 ecotype. The values presented are averages of three replicates. Error bars represent sd. C, Expression of the PR-1 gene in water- and glycerol-treated plants. RNA gel-blot analysis was performed on 7 μg of total RNA extracted 72 h after glycerol treatment. The ssi2 gly1-3 plants used in this study were 3 weeks old. Ethidium bromide staining of rRNA was used as a loading control. D, Comparison of the morphological phenotypes displayed by the 16-d-old soil-grown ssi2 and ssi2 nho1 plants. E, Microscopy of trypan blue-stained leaves from ssi2 and various ssi2 nho1 plants. F, Expression of the PR-1 gene in ssi2 and ssi2 nho1 plants. RNA gel-blot analysis was performed on 7 μg of total RNA extracted from 16-d-old soil-grown plants. Ethidium bromide staining of rRNA was used as a loading control.
Figure 7.
Figure 7.
Morphological and molecular phenotypes of ssi2 act1 and various ssi2 act1 fad triple-mutant plants. A, Comparison of the morphological phenotypes displayed by the 4-week-old soil-grown ssi2 act1 and various ssi2 act1 fad triple-mutant plants. B, Microscopy of trypan blue-stained leaves from ssi2 act1 and ssi2 act1 fad triple-mutant plants. C, Expression of the PR-1 gene in wild-type, ssi2, ssi2 act1, and various ssi2 act1 fad triple-mutant plants. RNA gel-blot analysis was performed on 5 μg of total RNA extracted from 4-week-old soil-grown plants. Ethidium bromide staining of rRNA was used as a loading control.
Figure 8.
Figure 8.
A condensed scheme for lipid biosynthesis and glycerol-mediated signaling in Arabidopsis leaves. De novo FA synthesis occurs exclusively in the plastids of all plant cells and leads to the synthesis of palmitic acid (16:0)-ACP and oleic acid (18:1)-ACP. These FAs enter glycerolipid synthesis either via the prokaryotic pathway in the inner envelope of chloroplasts or are exported out of plastids as CoA thioesters to enter the eukaryotic glycerolipid synthesis pathway. Desaturation of stearic acid (18:0)-ACP to 18:1-ACP catalyzed by the SSI2/FAB2-encoded stearoyl-ACP desaturase is one of the key steps in the FA biosynthesis pathway that regulates levels of unsaturated FAs in the cell. The 18:1-ACP generated in this reaction enters the prokaryotic pathway through acylation of G3P and this reaction is catalyzed by the ACT1-encoded G3P acyltransferase. G3P can be made via a cytosolic enzyme GK or via G3Pdh. Dotted line indicates that GK-derived G3P makes a minor contribution to the plastidal G3P pool. Desaturation of 18:1 to 18:2 and 18:3 on membrane glycerolipids (GL) is catalyzed by FAD6 and FAD7/FAD8-encoded desaturases, respectively, that are present on the plastid envelop. Esterification of the CoA group is mediated by acyl-CoA synthetase (ACS). CoA, Coenzyme A; Lyso-PA, acyl-G3P; SL, sulfolipid; DAG, diacylglycerol; DHAP, dihydroxyacetone phosphate.

References

    1. Browse J, McConn M, James D, Miquel M (1993) Mutants of Arabidopsis deficient in the synthesis of α-Linolenate: biochemical and genetic characterization of the endoplasmic reticulum linoleoyl desaturase. J Biol Chem 268: 16345–16351 - PubMed
    1. Browse J, McCourt P, Somerville CR (1985) A mutant of Arabidopsis lacking a chloroplast-specific lipid. Science 277: 763–765 - PubMed
    1. Cao H, Glazebrook J, Clarke JD, Volko S, Dong X (1997) The Arabidopsis NPR1 gene that controls systemic acquired resistance encodes a novel protein containing ankyrin repeats. Cell 88: 57–63 - PubMed
    1. Century KS, Shapiro AD, Repetti PP, Dahlbeck D, Holub E, Staskawicz BJ (1997) NDR1, a pathogen-induced component required for Arabidopsis disease resistance. Science 278: 1963–1965 - PubMed
    1. Chandra-Shekara AC, Gupte M, Navarre DA, Raina S, Raina R, Klessig D, Kachroo P (2006) Light-dependent hypersensitive response and resistance signaling to turnip crinkle virus in Arabidopsis. Plant J (in press) - PubMed

Publication types

MeSH terms