

Metabolite profiling of Chlamydomonas reinhardtii under nutrient deprivation
- PMID: 16306140
- PMCID: PMC1310576
- DOI: 10.1104/pp.105.071589
Metabolite profiling of Chlamydomonas reinhardtii under nutrient deprivation
Abstract
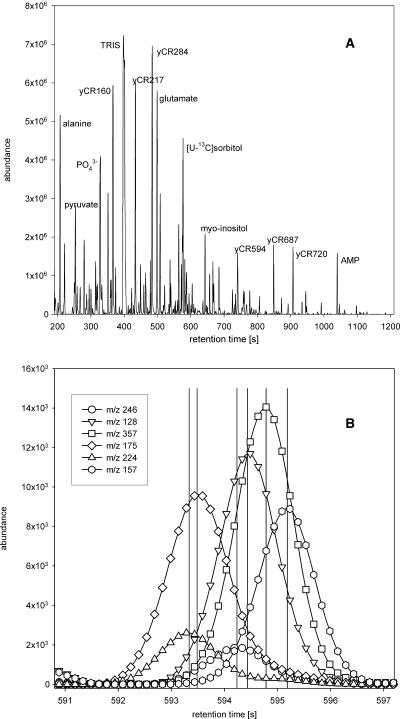
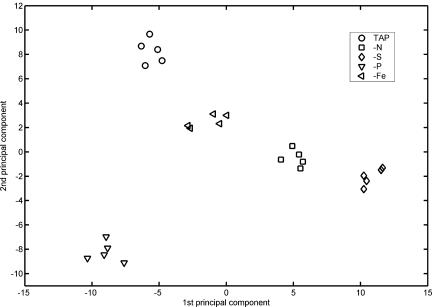
A metabolite profiling technique for Chlamydomonas reinhardtii cells for multiparallel analysis of low-molecular weight polar compounds was developed. The experimental protocol was optimized to quickly inactivate enzymatic activity, achieve maximum extraction capacity, and process large sample quantities. As a result of the rapid sampling, extraction, and analysis by gas chromatography coupled to time-of-flight mass spectrometry, more than 800 analytes from a single sample could be measured, of which more than 100 could be identified. Analyte responses could be determined mostly with ses less than 10%. Wild-type cells of C. reinhardtii strain CC-125 subjected to nitrogen-, phosphorus-, sulfur-, or iron-depleted growth conditions develop highly distinctive metabolite profiles. Individual metabolites undergo marked changes in their steady-state levels. Compared to control conditions, sulfur-depleted cells accumulated 4-hydroxyproline more than 50-fold, whereas the amount of 2-ketovaline was reduced to 2% of control levels. The contribution of each compound to the differences observed in the metabolic phenotypes is summarized in a quantitatively rigorous way by principal component analysis, which clearly discriminates the cells from different growth regimes and indicates that phosphorus-depleted conditions induce a deficiency syndrome quite different from the response to nitrogen, sulfur, or iron starvation.
Figures


References
-
- Abadia J, Lopez-Millan AF, Rombola A, Abadia A (2002) Organic acids and Fe deficiency: a review. Plant Soil 241: 75–86
-
- Barsch A, Patschkowski T, Niehaus K (2004) Comprehensive metabolite profiling of Sinorhizobium meliloti using gas chromatography-mass spectrometry. Funct Integr Genomics 4: 219–230 - PubMed
-
- Behrenfeld MJ, Kolber ZS (1999) Widespread iron limitation of phytoplankton in the south pacific ocean. Science 283: 840–843 - PubMed
-
- Bino RJ, Hall RD, Fiehn O, Kopka J, Saito K, Draper J, Nikolau BJ, Mendes P, Roessner-Tunali U, Beale MH, et al (2004) Potential of metabolomics as a functional genomics tool. Trends Plant Sci 9: 418–425 - PubMed
-
- Buchholz A, Hurlebaus J, Wandrey C, Takors R (2002) Metabolomics: quantification of intracellular metabolite dynamics. Biomol Eng 19: 5–15 - PubMed
Publication types
MeSH terms
Substances
LinkOut - more resources
Full Text Sources
Other Literature Sources
