Sensing of inorganic carbon limitation in Synechococcus PCC7942 is correlated with the size of the internal inorganic carbon pool and involves oxygen
- PMID: 16306144
- PMCID: PMC1310573
- DOI: 10.1104/pp.105.069146
Sensing of inorganic carbon limitation in Synechococcus PCC7942 is correlated with the size of the internal inorganic carbon pool and involves oxygen
Abstract
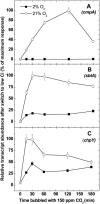
Freshwater cyanobacteria are subjected to large seasonal fluctuations in the availability of nutrients, including inorganic carbon (Ci). We are interested in the regulation of the CO2-concentrating mechanism (CCM) in the model freshwater cyanobacterium Synechococcus sp. strain PCC7942 in response to Ci limitation; however, the nature of Ci sensing is poorly understood. We monitored the expression of high-affinity Ci-transporter genes and the corresponding induction of a high-affinity CCM in Ci-limited wild-type cells and a number of CCM mutants. These genotypes were subjected to a variety of physiological and pharmacological treatments to assess whether Ci sensing might involve monitoring of fluctuations in the size of the internal Ci pool or, alternatively, the activity of the photorespiratory pathway. These modes of Ci sensing are congruent with previous results. We found that induction of a high-affinity CCM correlates most closely with a depletion of the internal Ci pool, but that full induction of this mechanism also requires some unresolved oxygen-dependent process.
Figures


Similar articles
-
Involvement of the cynABDS operon and the CO2-concentrating mechanism in the light-dependent transport and metabolism of cyanate by cyanobacteria.J Bacteriol. 2007 Feb;189(3):1013-24. doi: 10.1128/JB.01328-06. Epub 2006 Nov 22. J Bacteriol. 2007. PMID: 17122352 Free PMC article.
-
Transcriptional regulation of the CO2-concentrating mechanism in a euryhaline, coastal marine cyanobacterium, Synechococcus sp. Strain PCC 7002: role of NdhR/CcmR.J Bacteriol. 2007 May;189(9):3335-47. doi: 10.1128/JB.01745-06. Epub 2007 Feb 16. J Bacteriol. 2007. PMID: 17307862 Free PMC article.
-
Inorganic carbon limitation induces transcripts encoding components of the CO(2)-concentrating mechanism in Synechococcus sp. PCC7942 through a redox-independent pathway.Plant Physiol. 2003 Dec;133(4):2069-80. doi: 10.1104/pp.103.029728. Epub 2003 Nov 26. Plant Physiol. 2003. PMID: 14645730 Free PMC article.
-
CO2-concentrating mechanism in cyanobacterial photosynthesis: organization, physiological role, and evolutionary origin.Photosynth Res. 2013 Nov;117(1-3):133-46. doi: 10.1007/s11120-013-9860-z. Epub 2013 Jun 4. Photosynth Res. 2013. PMID: 23733616 Review.
-
Inorganic carbon transporters of the cyanobacterial CO2 concentrating mechanism.Photosynth Res. 2011 Sep;109(1-3):47-57. doi: 10.1007/s11120-010-9608-y. Epub 2011 Feb 26. Photosynth Res. 2011. PMID: 21359551 Review.
Cited by
-
Involvement of the cynABDS operon and the CO2-concentrating mechanism in the light-dependent transport and metabolism of cyanate by cyanobacteria.J Bacteriol. 2007 Feb;189(3):1013-24. doi: 10.1128/JB.01328-06. Epub 2006 Nov 22. J Bacteriol. 2007. PMID: 17122352 Free PMC article.
-
Over-expression of the β-carboxysomal CcmM protein in Synechococcus PCC7942 reveals a tight co-regulation of carboxysomal carbonic anhydrase (CcaA) and M58 content.Photosynth Res. 2011 Sep;109(1-3):33-45. doi: 10.1007/s11120-011-9659-8. Epub 2011 May 20. Photosynth Res. 2011. PMID: 21597987
-
Engineered Accumulation of Bicarbonate in Plant Chloroplasts: Known Knowns and Known Unknowns.Front Plant Sci. 2021 Aug 31;12:727118. doi: 10.3389/fpls.2021.727118. eCollection 2021. Front Plant Sci. 2021. PMID: 34531888 Free PMC article. Review.
-
Transcriptional regulation of the CO2-concentrating mechanism in a euryhaline, coastal marine cyanobacterium, Synechococcus sp. Strain PCC 7002: role of NdhR/CcmR.J Bacteriol. 2007 May;189(9):3335-47. doi: 10.1128/JB.01745-06. Epub 2007 Feb 16. J Bacteriol. 2007. PMID: 17307862 Free PMC article.
-
Functional cyanobacterial beta-carboxysomes have an absolute requirement for both long and short forms of the CcmM protein.Plant Physiol. 2010 May;153(1):285-93. doi: 10.1104/pp.110.154948. Epub 2010 Mar 19. Plant Physiol. 2010. PMID: 20304968 Free PMC article.
References
-
- Bader KP, Schmid GH (1989) Photosynthetic and respiratory oxygen gas-exchange measured by mass-spectrometry in the filamentous cyanobacterium Oscillatoria chalybea is dependent on the nitrogen-source in the growth-medium. Biochim Biophys Acta 974: 303–310
-
- Badger MR, Palmqvist K, Yu JW (1994) Measurement of CO2 and HCO3− fluxes in cyanobacteria and microalgae during steady-state photosynthesis. Physiol Plant 90: 529–536
-
- Badger MR, Price GD (2003) CO2 concentrating mechanisms in cyanobacteria: molecular components, their diversity and evolution. J Exp Bot 54: 609–622 - PubMed
-
- Badger MR, Schreiber U (1993) Effects of inorganic carbon accumulation on photosynthetic oxygen reduction and cyclic electron flow in the cyanobacterium Synechococcus PCC7942. Photosynth Res 37: 177–191 - PubMed
MeSH terms
Substances
LinkOut - more resources
Full Text Sources

