

Cell expansion and endoreduplication show a large genetic variability in pericarp and contribute strongly to tomato fruit growth
- PMID: 16306145
- PMCID: PMC1310575
- DOI: 10.1104/pp.105.068767
Cell expansion and endoreduplication show a large genetic variability in pericarp and contribute strongly to tomato fruit growth
Abstract
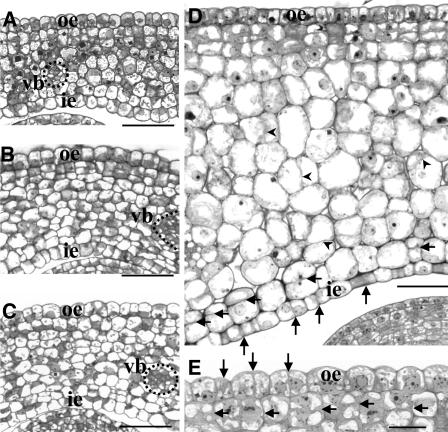
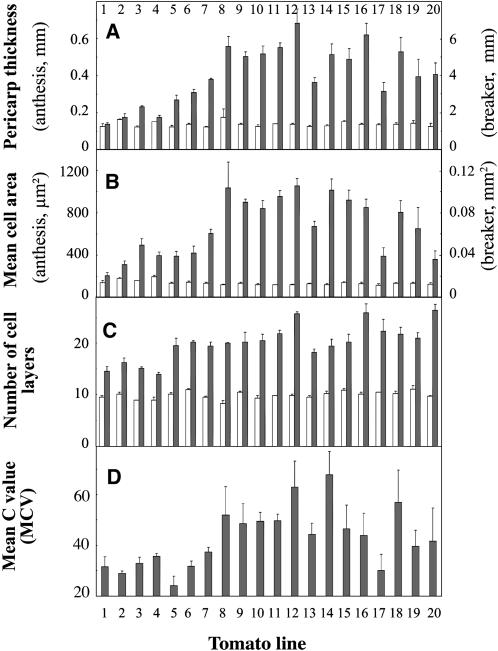
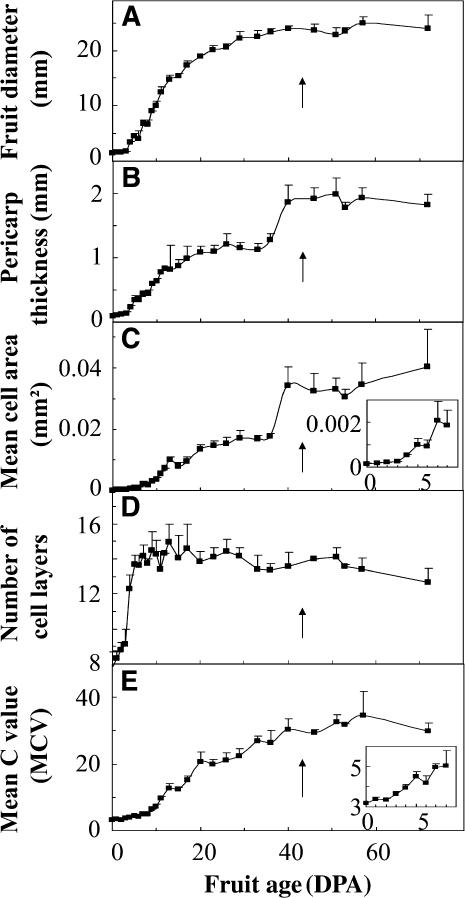
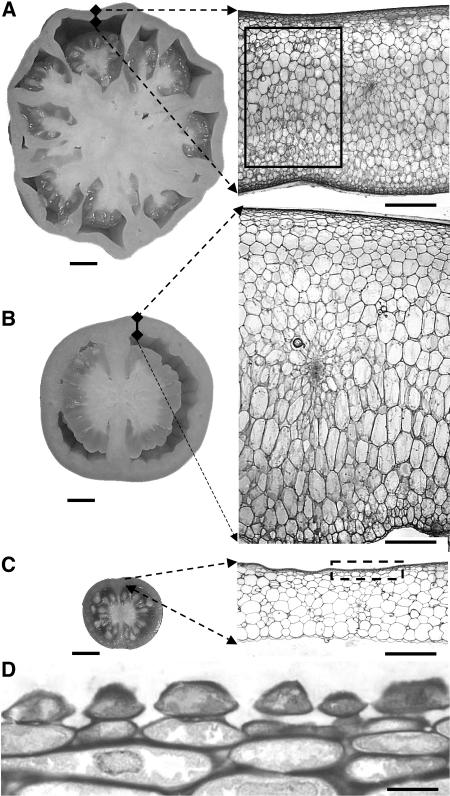
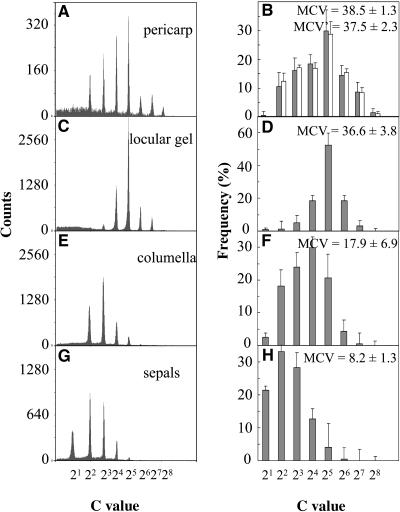
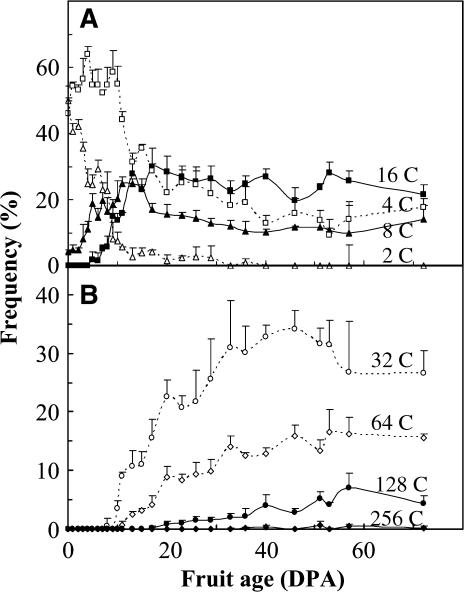
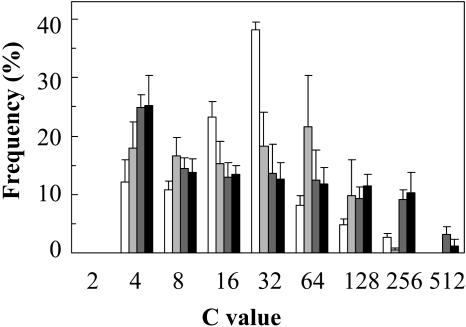
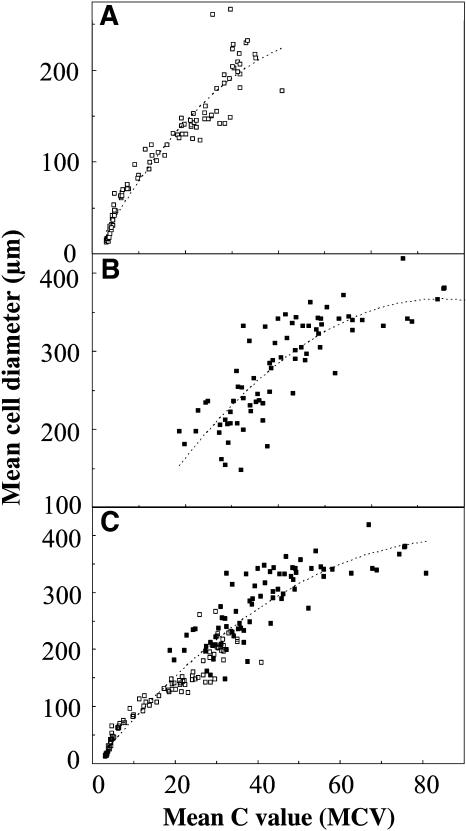
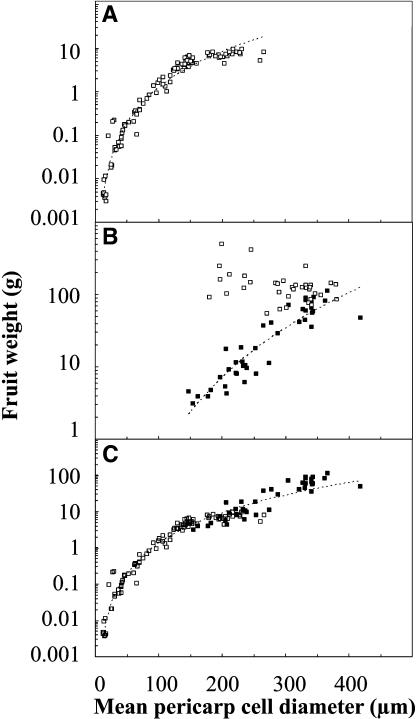
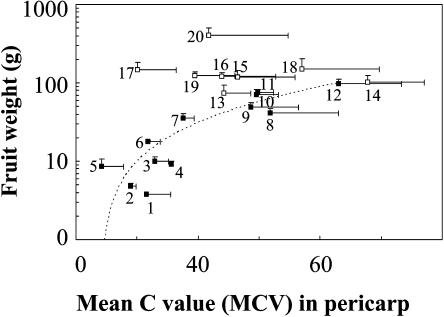
Postanthesis growth of tomato (Solanum lycopersicon) as of many types of fruit relies on cell division and cell expansion, so that some of the largest cells to be found in plants occur in fleshy fruit. Endoreduplication is known to occur in such materials, which suggests its involvement in cell expansion, although no data have demonstrated this hypothesis as yet. We have analyzed pattern formation, cell size, and ploidy in tomato fruit pericarp. A first set of data was collected in one cherry tomato line throughout fruit development. A second set of data was obtained from 20 tomato lines displaying a large weight range in fruit, which were compared as ovaries at anthesis and as fully grown fruit at breaker stage. A remarkable conservation of pericarp pattern, including cell layer number and cell size, is observed in all of the 20 tomato lines at anthesis, whereas large variations of growth occur afterward. A strong, positive correlation, combining development and genetic diversity, is demonstrated between mean cell size and ploidy, which holds for mean cell diameters from 10 to 350 microm (i.e. a 32,000-times volume variation) and for mean ploidy levels from 3 to 80 C. Fruit weight appears also significantly correlated with cell size and ploidy. These data provide a framework of pericarp patterning and growth. They strongly suggest the quantitative importance of polyploidy-associated cell expansion as a determinant of fruit weight in tomato.
Figures
Similar articles
-
Cell layer-specific patterns of cell division and cell expansion during fruit set and fruit growth in tomato pericarp.J Exp Bot. 2017 Mar 1;68(7):1613-1623. doi: 10.1093/jxb/erx058. J Exp Bot. 2017. PMID: 28369617 Free PMC article.
-
Analysis of the tomato fruit growth response to temperature and plant fruit load in relation to cell division, cell expansion and DNA endoreduplication.Ann Bot. 2005 Feb;95(3):439-47. doi: 10.1093/aob/mci042. Epub 2004 Dec 6. Ann Bot. 2005. PMID: 15582899 Free PMC article.
-
Tissue dependent variations of DNA methylation and endoreduplication levels during tomato fruit development and ripening.Planta. 2008 Aug;228(3):391-9. doi: 10.1007/s00425-008-0743-z. Epub 2008 May 17. Planta. 2008. PMID: 18488247
-
Fruit growth-related genes in tomato.J Exp Bot. 2015 Feb;66(4):1075-86. doi: 10.1093/jxb/eru527. Epub 2015 Jan 7. J Exp Bot. 2015. PMID: 25573859 Review.
-
Endoreduplication and fruit growth in tomato: evidence in favour of the karyoplasmic ratio theory.J Exp Bot. 2014 Jun;65(10):2731-46. doi: 10.1093/jxb/ert366. Epub 2013 Nov 1. J Exp Bot. 2014. PMID: 24187421 Review.
Cited by
-
Cytokinins is involved in regulation of tomato pericarp thickness and fruit size.Hortic Res. 2022 Jan 19;9:uhab041. doi: 10.1093/hr/uhab041. Online ahead of print. Hortic Res. 2022. PMID: 35043193 Free PMC article.
-
Genome size and endoreplication in two pairs of cytogenetically contrasting species of Pulmonaria (Boraginaceae) in Central Europe.AoB Plants. 2022 Aug 18;14(5):plac036. doi: 10.1093/aobpla/plac036. eCollection 2022 Oct. AoB Plants. 2022. PMID: 36128515 Free PMC article.
-
SIAMESE cooperates with the CDH1-like protein CCS52A1 to establish endoreplication in Arabidopsis thaliana trichomes.Genetics. 2010 May;185(1):257-68. doi: 10.1534/genetics.109.113274. Epub 2010 Mar 1. Genetics. 2010. PMID: 20194967 Free PMC article.
-
Increase in fruit size of a spontaneous mutant of 'Gala' apple (Malus x domestica Borkh.) is facilitated by altered cell production and enhanced cell size.J Exp Bot. 2010 Jun;61(11):3003-13. doi: 10.1093/jxb/erq134. Epub 2010 May 19. J Exp Bot. 2010. PMID: 20484321 Free PMC article.
-
Improvement of recombinant miraculin production in transgenic tomato by crossbreeding-based genetic background modification.Transgenic Res. 2022 Oct;31(4-5):567-578. doi: 10.1007/s11248-022-00320-y. Epub 2022 Aug 17. Transgenic Res. 2022. PMID: 35974134
References
-
- Barow M, Meister A (2003) Endopolyploidy in seed plants is differently correlated to systematics, organ, life strategy and genome size. Plant Cell Environ 26: 571–584
-
- Bergervoet J, Verhoeven H, Glilissen L, Bino R (1996) High amounts of nuclear DNA in tomato (Lycopersicon esculentum Mill) pericarp. Plant Sci 116: 141–145
-
- Bohner J, Bangerth F (1988) Cell number, cell size and hormone levels in semi-isogenic mutants of Lycopersicon pimpinellifolium differing in fruit size. Physiol Plant 72: 316–320
Publication types
MeSH terms
LinkOut - more resources
Full Text Sources
Other Literature Sources
