Clinical Trial
. 2005 Dec 6;102(49):17804-9.
doi: 10.1073/pnas.0503082102. Epub 2005 Nov 23.

Perfusion functional MRI reveals cerebral blood flow pattern under psychological stress

Affiliations
Clinical Trial

Perfusion functional MRI reveals cerebral blood flow pattern under psychological stress

Jiongjiong Wang et al. Proc Natl Acad Sci U S A. .

Abstract

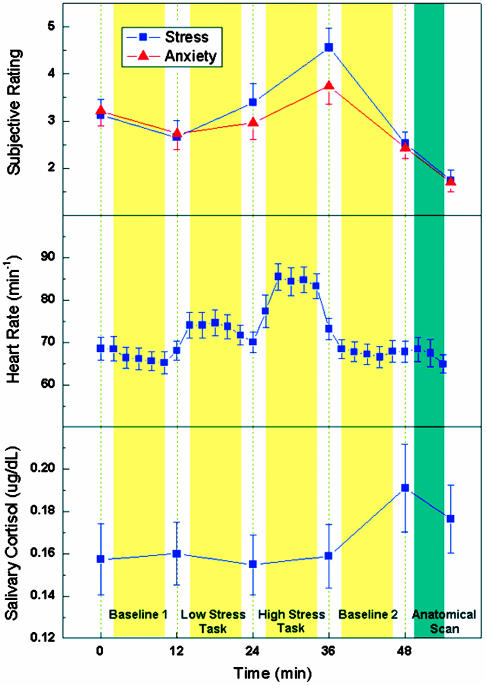
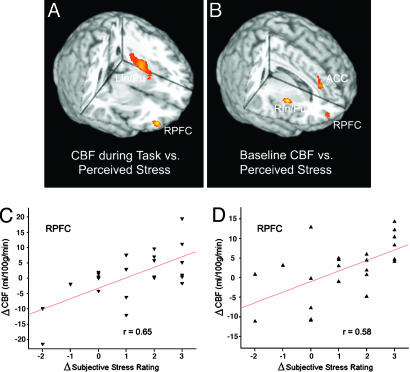
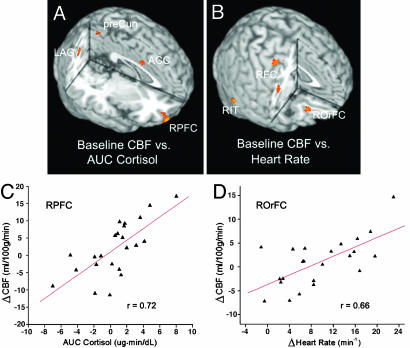
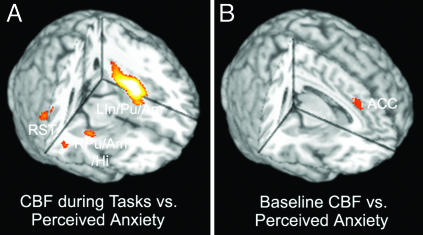
Despite the prevalence of stress in everyday life and its impact on happiness, health, and cognition, little is known about the neural substrate of the experience of everyday stress in humans. We use a quantitative and noninvasive neuroimaging technique, arterial spin-labeling perfusion MRI, to measure cerebral blood flow (CBF) changes associated with mild to moderate stress induced by a mental arithmetic task with performance monitoring. Elicitation of stress was verified by self-report of stress and emotional state and measures of heart rate and salivary-cortisol level. The change in CBF induced by the stress task was positively correlated with subjective stress rating in the ventral right prefrontal cortex (RPFC) and left insula/putamen area. The ventral RPFC along with right insula/putamen and anterior cingulate showed sustained activation after task completion in subjects reporting a high stress level during arithmetic tasks. Additionally, variations of baseline CBF in the ventral RPFC and right orbitofrontal cortex were found to correlate with changes in salivary-cortisol level and heart rate caused by undergoing stress tasks. We further demonstrated that the observed right prefrontal activation could not be attributed to increased cognitive demand accompanying stress tasks and extended beyond neural pathways associated with negative emotions. Our results provide neuroimaging evidence that psychological stress induces negative emotion and vigilance and that the ventral RPFC plays a key role in the central stress response.


Figures

Fig. 1.
Fig. 1.
Average subjective ratings of stress and anxiety, heart rate, and salivary-cortisol level during the time course of the stress experiment. Time 0 indicates the start of MRI experiments. The yellow columns represent the perfusion fMRI scans (each 8 min) and the dark green column represents the anatomical scan. Behavioral ratings and salivary-cortisol samples were taken between scans, whereas heart rate was continuously recorded every 2 min. Note that the peak in salivary-cortisol level lags behind other measures. The error bars indicate standard error.
Fig. 2.
Fig. 2.
Three-dimensional rendering of the regression-analysis results, which use the CBF change during stress tasks (high-stress - low-stress task) (A) or the CBF change at baseline (baseline 2 - baseline 1) (B) as the dependent variable and the change in perceived stress from the low- to high-stress task as the predictor. Also shown are scatterplots of changes in CBF during stress tasks (C) and at baseline (D) as a function of changes in perceived stress between the two stress tasks. Each data point represents one subject. Mean CBF values are drawn from the ROI defined by the activation cluster. RPFC x = 42, y = 54, z = -10, 211 pixels, Z = 3.59 in A; x = 32, y = 58, z = -2, 118 pixels, Z = 2.98 in B. ACC x = 10, y = 38, z = 24, 156 pixels, Z = 3.22; LIn/Pu x = -32, y = -8, z = 4, 811 pixels, Z = 3.46; right insula/putamen (RIn/Pu) x = 38, y = 2, z = 2, 144 pixels, Z = 3.73.
Fig. 3.
Fig. 3.
Three-dimensional rendering of the regression-analysis results, which use the CBF change at baseline (baseline 2 - baseline 1) as the dependent variable and the AUC measures of salivary-cortisol level (A) or the change in heart rate from the low- to high-stress task (B) as the predictor. Also shown are scatterplots of mean baseline CBF changes as a function of cortisol (C) and heart rate (D) in activation clusters. RPFC x = 30, y = 56, z = -16, 406 pixels, Z = 3.79; right obitofrontal cortex (ROrFC) x = 26, y = 34, z = -16, 100 pixels, Z = 3.51; precuneus (preCun) x = 6, y = -56, z = 54, 205 pixels, Z = 3.03; left angular gyrus (LAG) x = -40, y = -64, z = 32, 304 pixels, Z = 3.15; right angular gyrus (RAG) x = 26, y = -60, z = 40, 241 pixels, Z = 3.38; right frontal cortex (RFC) x = 56, y = -2, z = 24, 233 pixels, Z = 3.12 and x = 32, y = -10, z = 54, 198 pixels, Z = 3.23; right inferior temporal cortex (RIT) x = 62, y = -54, z = -16, 176 pixels, Z = 3.68.
Fig. 4.
Fig. 4.
Three-dimensional rendering of the regression-analysis results, which use the CBF change during stress tasks (high-stress - low-stress task) (A) or the CBF change at baseline (baseline 2 - baseline 1) (B) as the dependent variable and the change in perceived anxiety from the low- to high-stress task as the predictor. LIn/Pu/amygdala (LIn/Pu/Am) x = -36, y = -6, z = -4, 2,379 pixels, Z = 5.30; right putamen/amygdala/hippocampus (RPu/Am/Hi) x = 34, y = -12, z = -10, 339 pixels, Z = 3.21; right superior temporal cortex (RST) x = 52, y = -44, z = 16, 432 pixels, Z = 3.58; ACC x = 6, y = 32, z = 32, 162 pixels, Z = 2.83.

References

    1. Segerstrom, S. C. & Miller, G. E. (2004) Psychol. Bull. 130, 601-630. - PMC - PubMed
    1. Cohen, S., Tyrrell, D. A. J. & Smith, A. P. (1993) J. Personality Social Psychol. 64, 131-140. - PubMed
    1. Caspi, A., Sugden, K., Moffitt, T. E., Taylor, A., Craig, I. W., Harrington, H., McClay, J., Mill, J., Martin, J., Braithwaite, A. & Poulton, R. (2003) Science 301, 386-389. - PubMed
    1. McEwen, B. S. & Sapolsky, R. M. (1995) Curr. Opin. Neurobiol. 5, 205-216. - PubMed
    1. Sapolsky, R. M. (2000) Neurobiol. Dis. 7, 540-542. - PubMed

Publication types