. 2005 Nov 23;25(47):10941-51.
doi: 10.1523/JNEUROSCI.0164-05.2005.

Emerging patterns of neuronal responses in supplementary and primary motor areas during sensorimotor adaptation

Affiliations

Emerging patterns of neuronal responses in supplementary and primary motor areas during sensorimotor adaptation

Rony Paz et al. J Neurosci. .

Abstract

Acquisition and retention of sensorimotor skills have been extensively investigated psychophysically, but little is known about the underlying neuronal mechanisms. Here we examine the evolution of neural activity associated with adaptation to new kinematic tasks in two cortical areas: the caudal supplementary motor area (SMA proper), and the primary motor cortex (MI). We investigate the hypothesis that adaptation starts at premotor areas, i.e., higher in the hierarchy of computation, until a stable representation is formed in primary areas. In accordance with previous studies, we found that adaptation can be characterized by two phases: an early phase that is accompanied by fast and substantial reduction of errors, followed by a late phase with slower and more moderate improvements in behavior. We used unsupervised clustering to separate the activity of the single cells into groups of cells with similar response patterns, under the assumption that each such subpopulation forms a functional unit. We specifically observed the number of clusters in each cortical area during early and late phases of the adaptation and found that the number of clusters is higher in the SMA during early phases of adaptation. In contrast, a higher number of clusters was observed in MI only during late phases. Our results suggest a new approach to analyze responses of large populations of neurons and use it to show a hierarchy of dynamic reorganization of functional groups during adaptation.


Figures
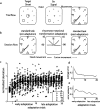
Figure 1.
Figure 1.
Experimental design and behavior. a, Trial flow, Left, The monkeys had to hold the cursor in the central circle (origin) to lit one of eight targets (spaced by 45°, at 4 cm distance from the origin). Middle, The origin circle disappears 750-1500 ms after target onset; this is the go signal. Right, After the go signal, the monkey was required to move its hand to bring the cursor into the target in <1500 ms. b, Session flow, Left, The monkey first performed a standard eight-direction task, in which the movement of the hand was in 1:1 relation to the movement of the cursor. Middle, A rotational transformation was introduced, so that the movement of the cursor was rotated by -90, -45, 45, or 90° to the movement of the hand. Only one of these four transformations was introduced in a session, and only one target (upwards) was introduced. Right, The standard task was performed again. c, Learning curve. Normalized deviation is the discrepancy between the visual target and the actual hand movement, normalized by the transformation imposed in the session. Data are pooled from all sessions and four different transforms performed by both monkeys and are presented as a function of trial number in the adaptation. The solid line represents the best exponent fit. d, Average error, One minus the average (over sessions) of the normalized deviations presented in c. e, Error variance is the variance (over sessions) of the normalized deviations presented in c.
Figure 2.
Figure 2.
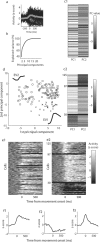
Clustering of neuronal responses. MRA from 125 most responsive (Mann-Whitney test, p < 0.02) cells in MI during performance of the standard task (preadaptation) is used to demonstrate the clustering procedure. For each cell, spike count was averaged over trials in 10 ms bins, smoothed with a Gaussian window, and z-score transformed to produce activity vectors (PETHs, overlaid in a, gray thick line is the average of all cells, zero time is the beginning of movement as calculated off-line with a slope algorithm). A subset of 500 ms (from -200 to 300, a vector of length 50) from each cell was used for the PCA. b, Cumulative explained variance as a function of the first (largest) 25 eigenvalues; in general, <8 eigenvectors accounted for >80% of the variance for all conditions, and this spectrum did not differ significantly across cases. For the illustration here, we use only the first two. c1, Principal components (PC, columns) for all cells (rows) in a random order; the values of the first principal component (PC1, left column) and the second (PC2, right column) are represented in grayscale. d, PCs of all cells. The different shapes (x symbols, circles, and squares) correspond to the different clusters formed by k-means. Also shown are the shapes of the first two eigenvectors (EV1, EV2). c2, Same as c1, but rows are rearranged according to the association of the cells to the clusters. e1, PETHs from all cells shown in a. Each row is a PETH of one cell, grayscaled by the (z-transformed) firing rate intensity in 10 ms bins. The rows are randomly ordered. e2, Same data, but rows are rearranged according to the association of the cells to the clusters. f1-f3, Response patterns, average PETH from all cells within one cluster, for the three clusters separately.
Figure 3.
Figure 3.
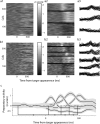
Clusters during preadaptation versus late-adaptation. a, Normalized PETHs of preparatory activity of all neurons in MI of monkey 1 during the preadaptation period (standard task). Each row is a PETH of one cell, grayscaled by the (z-transformed) firing rate intensity in 10 ms bins. In a1, cells are presented in a random order; in a2, cells are rearranged according to their association to three clusters (borders between clusters are marked in thick black lines). In a3, PETHs of typical cells are superimposed separately for each cluster; cells within each cluster are sorted according to their distance from the center of the cluster, and the 35 middle ones are taken for presentation. b, Same presentation as in a but for preparatory activity in MI during the late-adaptation period. Cells are clustered into five different clusters and reveal different peaks and onsets of activation. c, Response patterns of preparatory activity in MI during late adaptation. Each response pattern is the average PETH (in z-score) from all cells within one cluster, with gray-shaded 0.95 confidence intervals. Vertical lines depict the average peak time of all cells within a cluster (note the close agreement with the peak time of the response pattern), and asterisks represent that the mean peak time was significantly different than the mean peak time of the preceding cluster (one-tailed t test, p < 0.05).
Figure 4.
Figure 4.
Determining the number of clusters. Gap analysis for preparatory activity in MI during all four behavioral periods. Shown is the chosen number of clusters (k), with the matching gap curve. Gap curves are based on the difference between the total within-cluster distances for the real data to that for a simulated data (uniformly spanning the same range of values). Notice that for preadaptation, early adaptation, and postadaptation (a, b, d) the curve is peaked at two to three clusters and drops right after, whereas in late adaptation (c), the curve drops only above five to six clusters. This indicates that, in this case, there is benefit in separating the data into more clusters (for formalization of criterion, see Materials and Methods).
Figure 5.
Figure 5.
Response patterns in MI. Averaged PETHs from all neurons associated with a cluster, for all clusters. Columns show (from left to right) responses during performance of a standard task before adaptation (preadaptation a1, b1), early adaptation to visuomotor rotational task (a2, b2), late adaptation to the visuomotor task (a3, b3), and performance of standard task after adaptation (postadaptation, a4, b4). Rows show responses for preparatory activity (a1-a4) and movement-related activity (b1-b4). For presentation purposes, the PETHs are shown in a time window from -500 to +750 ms around a behavioral event: target appearance (top row, preparatory activity) and movement onset (bottom row, movement-related activity). The clustering itself was performed using a smaller window of 500 ms from 0 to 500 ms around the target appearance and from -200 to +300 ms around the movement onset. Clusters are sorted according to the number of neurons that are associated with them and presented in a matching grayscale. Insets show the clusters when analyzing separately neurons from the first monkey (left) and from the second (right). Note that typical response patterns with a small number of clusters (3) were observed in most cases, but a higher number (5) was observed for preparatory activity during late adaptation (a3).
Figure 6.
Figure 6.
Response patterns in SMA. Same format as in Figure 5. For SMA, typical response patterns with a small number of clusters (3) were observed in most cases, but a higher number (5) was observed for preparatory activity and for movement-related activity during early adaptation (a2, b2).
Figure 7.
Figure 7.
Number of clusters best explaining the neuronal responses in SMA and MI. a, The average number of clusters for all cases. The gray vertical bars show 0.05 confidence intervals calculated by silhouette analysis based on fitting a Poisson distribution to bootstrap statistics. A significant increase in the number of clusters was observed in MI for preparatory activity during late adaptation and in SMA during early adaptation for both preparatory activity and movement-related activity. b, Filled rectangles represent clusters with a significant number of cells with significant modulation. Each cell was tested individually for a significant modulation of activity (paired t test over single trials, p < 0.05), and the number of such cells within each cluster separately was tested against the chance ratio of 5% (Fisher's exact test, p < 0.05). b1, PA in MI; b2, MRA in MI; b3, PA in SMA; b4, MRA in SMA.
Figure 8.
Figure 8.
Changes in cluster membership of individual neurons. Each entry in a matrix designates a combination of a cluster from a given behavioral period (rows) to the preadaptation period and represents the number of cells that were assigned to these clusters in the two behavioral periods accordingly. The matrix is then normalized by its sum to obtain joint probabilities and divided by the product distribution obtained from multiplying the marginal distributions; the log of this ratio is presented by grayscale. Thus, a positive number represents a higher than expected number of cells for this entry and a negative number vice versa. The response patterns of the clusters are shown to the sides, and the actual number of cells in each entry is shown by the bar graph to the right. a, MRA in MI during preadaptation versus postadaptation. A clear diagonal means that cells tend to keep their cluster membership (see the matching response patterns). b, PA in MI during preadaptation versus postadaptation. c, PA in MI during prelearning versus late adaptation. formula image
Figure 9.
Figure 9.
Similarities of response patterns. Similarity (symmetric) matrices between response patterns of clusters in the four behavioral periods (preadaptation, early adaptation, late adaptation, and postadaptation). Each value is the average Pearson's correlation coefficient (average over correlations between the shapes of the clusters in the two periods). For preparatory activity in MI (top left), the matrix shows that the patterns during the late adaptation phase were the most dissimilar to others (darker strips). For movement-related activity in MI (top right), high correlations (>0.6) were observed between all periods. The preparatory activity in SMA (bottom left) in early adaptation was the most dissimilar to all other periods. Movement-related activity in SMA (bottom right) during early adaptation also differs from all other periods.
Figure 10.
Figure 10.
The number of clusters that best describes the data are robust to the number of trials and sensitivity of the cells to direction. Distributions of k values for 50 repetitions of random samplings with replacement from neuronal data during preadaptation and postadaptation periods. For each repetition, we calculated the k value (number of clusters best describing the data) using silhouette analysis. All distributions are clearly centered on three clusters, showing that the increased number of clusters found during adaptation does not result from a larger number of trials that was used for the standard task (a, based on samplings of 10 trials from preadaptation and postadaptation periods in both areas and activity periods) or from pooling the eight directions used during the standard task [b, based on analysis of preadaptation in MI using only movements to the preferred direction of the cells and the two adjacent directions (±45°)]. c, d, Response patterns for MRA in MI during the preadaptation period using only movements to the preferred direction of the cells (c) and the direction opposite to it (d). Whereas slight and expected differences can be observed, the responses of the clusters show similar temporal patterns to those found using all movement directions pooled together.

References

    1. Aizawa H, Inase M, Mushiake H, Shima K, Tanji J (1991) Reorganization of activity in the supplementary motor area associated with motor learning and functional recovery. Exp Brain Res 84: 668-671. - PubMed
    1. Alexander GE, Crutcher MD (1990) Preparation for movement: neural representations of intended direction in three motor areas of the monkey. J Neurophysiol 64: 133-150. - PubMed
    1. Brasted PJ, Wise SP (2004) Comparison of learning-related neuronal activity in the dorsal premotor cortex and striatum. Eur J Neurosci 19: 721-740. - PubMed
    1. Cisek P, Scott SH (1999) An alternative interpretation of population vector rotation in macaque motor cortex. Neurosci Lett 272: 1-4. - PubMed
    1. Cohen D, Nicolelis MA (2004) Reduction of single-neuron firing uncertainty by cortical ensembles during motor skill learning. J Neurosci 24: 3574-3582. - PMC - PubMed

Publication types

LinkOut - more resources