. 2005 Nov 23;25(47):10990-1002.
doi: 10.1523/JNEUROSCI.3229-05.2005.

Spatiotemporal gating of sensory inputs in thalamus during quiescent and activated states

Affiliations

Spatiotemporal gating of sensory inputs in thalamus during quiescent and activated states

Juan R Aguilar et al. J Neurosci. .

Abstract

The main role of the thalamus is to relay sensory inputs to the neocortex according to the regulations dictated by behavioral state. Hence, changes in behavioral state are likely to transform the temporal and spatial properties of thalamocortical receptive fields. We compared the receptive fields of single cells in the ventroposterior medial thalamus (VPM) of urethane-anesthetized rats during quiescent states and during aroused (activated) states. During quiescent states, VPM cells respond to stimulation of a principal whisker (PW) and may respond modestly to one or a few adjacent whiskers (AWs). During either generalized forebrain activation or selective thalamic activation caused by carbachol infusion in the VPM, the responses to AWs enhance so that VPM receptive fields become much larger. Such enlargement is not observed at the level of the principal trigeminal nucleus, indicating that it originates within the thalamus. Interestingly, despite the increase in AW responses during activation, simultaneous deflection of the PW and AWs produced VPM responses that resembled the PW response, as if the AWs were not stimulated. This nonlinear summation of sensory responses was present during both quiescent and activated states. In conclusion, the thalamus suppresses the excitatory surround (AWs) of the receptive field during quiescent states and enlarges this surround during arousal. But, thalamocortical cells represent only the center (PW) of the receptive field when the center (PW) and surround (AWs) are stimulated simultaneously.


Figures

Figure 1.
Figure 1.
Location of electrodes in the VPM. A, Cresyl violet-stained coronal section shows the positioning of recording electrodes and microdialysis probes in the VPM. Note the tract left by the microdialysis probe entering the VPM. The probe was inserted into the brain at an angle from the midline, and the recording electrode was inserted parallel to the midline into the VPM. The cell shown in B was located in the dorsal portion of the VPM. B, Reconstruction of a juxta-cellular labeled VPM cell in the coronal plane.
Figure 2.
Figure 2.
Representative activity of a VPM cell during quiescent and activated states caused by manipulating the level of anesthesia. A, Sample field potential activity recorded from the frontal neocortex during quiescent and activated states. B, Power-spectrum analysis of the frontal cortex field potential activity derived by calculating FFTs for the quiescent and activated periods during which the PSTHs in C and D were obtained. C, PSTHs showing responses to stimulation of the PW (D2) and five AWs (E2-D4) during quiescent (black traces) and activated (gray traces) states at 0.1 Hz. The response to simultaneous stimulation of the six whiskers (bottom row) is also shown. The algebraic sum of the responses to individual stimulation of the six whiskers (light gray trace) was overlaid for comparison with the simultaneous stimulation. D, Overlaid PSTHs of whisker stimulation delivered at 2, 10, and 20 Hz during quiescent (black traces) and activated (gray traces) states.
Figure 3.
Figure 3.
Population PSTHs during quiescent and activated states caused by RF stimulation. A, Spontaneous activity of the VPM cells (n = 15) measured during a 1 s time window in the absence of whisker stimulation during quiescent and activated states. During RF stimulation trials, this window corresponds to the period between the offset of the RF stimulation and the onset of the whisker stimulation. During control (quiescent) trials, this period corresponds to 1 s before the whisker stimulus. B, Average PSTHs of low-frequency (0.1 Hz) PW and AW responses during quiescent (black traces) and activated (gray traces) states. C, Average PSTHs of high-frequency (10 Hz) PW and AW responses during quiescent and activated states. stim., Stimulation.
Figure 4.
Figure 4.
Population data showing the effect of activation caused by RF stimulation on PW and AW responses in Pr5 cells. A, Spontaneous activity of Pr5 cells (n = 18) and VPM cells (n = 7) measured during a 1 s time window before whisker stimulation during quiescent and activated states produced by RF stimulation. The VPM cells were recorded simultaneously with Pr5 cell pairs included in the Pr5 group. This population of Pr5 cells was not identified using antidromic stimulation and may contain both VPM-projecting and nonprojecting cells. B, Average PSTHs of low-frequency (0.1 Hz) PW and AW responses during quiescent and activated states. This population includes Pr5 cells not identified using antidromic tests (n = 18) and cells identified as projecting to the VPM (n = 8). stim., Stimulation.
Figure 5.
Figure 5.
Representative activity of a VPM cell during thalamic activation caused by application of carbachol in the VPM. A, Sample field potential activity recorded from the frontal neocortex during quiescent and thalamic activation states caused by carbachol application in the VPM. B, Power-spectrum analysis of the frontal cortex field potential activity derived by calculating FFTs for the quiescent and thalamic activated periods during which the PSTHs in C and D were obtained. C, PSTHs showing responses to stimulation of the PW (D2) and five AWs (E2-D4) during quiescent (black traces) and activated (gray traces) states. The response to simultaneous stimulation of the six whiskers (bottom row) is also shown. The algebraic sum of the responses to individual stimulation of the six whiskers (light gray trace) was overlaid for comparison with the simultaneous stimulation. D, Overlaid PSTHs of whisker stimulation delivered at 2, 10, and 20 Hz during quiescent (black traces) and thalamic activated (gray traces) states.
Figure 6.
Figure 6.
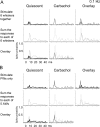
Population PSTHs of multiwhisker responses. A, Population PSTH (n = 6) of responses evoked by simultaneously stimulating six whiskers, including the PW and five AWs (top row) and PSTHs consisting of the algebraic sum of the responses to each of these six whiskers stimulated alone (middle row) during quiescent states and during thalamic activation caused by application of carbachol in the VPM. The right column and bottom row overlay the PSTHs of responses shown in the vertically or horizontally aligned panels for comparison. B, Population PSTH (n = 6) of responses evoked by stimulating the PW alone (top row) or PSTHs consisting of the algebraic sum of the responses to each of the five AWs (middle row) during quiescent states and during thalamic activation caused by application of carbachol in the VPM. The right column and bottom row overlay the PSTHs of responses shown in the vertically or horizontally aligned panels for comparison. PSTHs display spike probability per 1 ms bin.
Figure 7.
Figure 7.
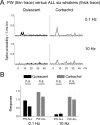
Comparison of responses evoked by the PW alone and responses evoked by all six whiskers stimulated together. A, Population PSTH (n = 6) of responses evoked by stimulating the PW alone (thin traces) or all six whiskers simultaneously, including the PW (thick traces). Different panels correspond to responses during quiescent and thalamic activation states caused by application of carbachol, during low-frequency (0.1 Hz) and high-frequency (10 Hz) whisker stimulation. B, Comparison of responses evoked by the PW and all six whiskers during the different conditions. Responses were measured by summing the spikes evoked during a 20 ms time window starting 3 ms after the whisker stimulus (non-paired t test). For 10 Hz stimulation, the last response in a 10 stimuli train was used. Error bars represent SD. n.s., Nonsignificant.

References

    1. Ahissar E, Sosnik R, Haidarliu S (2000) Transformation from temporal to rate coding in a somatosensory thalamocortical pathway. Nature 406: 302-306. - PubMed
    1. Armstrong-James M, Callahan CA (1991) Thalamo-cortical processing of vibrissal information in the rat. II. spatiotemporal convergence in the thalamic ventroposterior medial nucleus (VPm) and its relevance to generation of receptive fields of S1 cortical “barrel” neurones. J Comp Neurol 303: 211-224. - PubMed
    1. Berg RW, Friedman B, Schroeder LF, Kleinfeld D (2005) Activation of nucleus basalis facilitates cortical control of a brain stem motor program 2. J Neurophysiol 94: 699-711. - PubMed
    1. Bernardo KL, Woolsey TA (1987) Axonal trajectories between mouse somatosensory thalamus and cortex. J Comp Neurol 258: 542-564. - PubMed
    1. Brecht M, Sakmann B (2002) Whisker maps of neuronal subclasses of the rat ventral posterior medial thalamus, identified by whole-cell voltage recording and morphological reconstruction. J Physiol (Lond) 538: 495-515. - PMC - PubMed

Publication types

LinkOut - more resources