

Effect of bottlenecking on evolution of the nonstructural protein 3 gene of hepatitis C virus during sexually transmitted acute resolving infection
- PMID: 16306585
- PMCID: PMC1316027
- DOI: 10.1128/JVI.79.24.15131-15141.2005
Effect of bottlenecking on evolution of the nonstructural protein 3 gene of hepatitis C virus during sexually transmitted acute resolving infection
Abstract
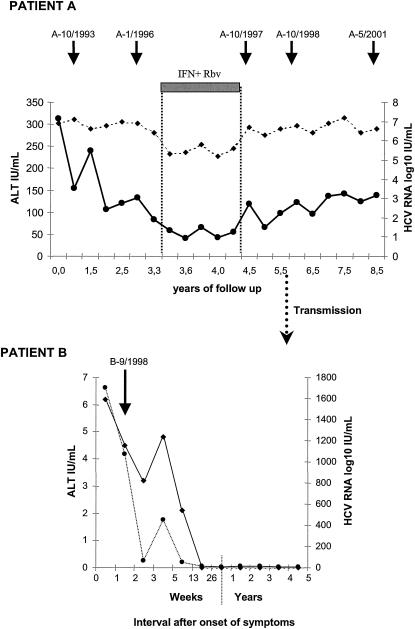
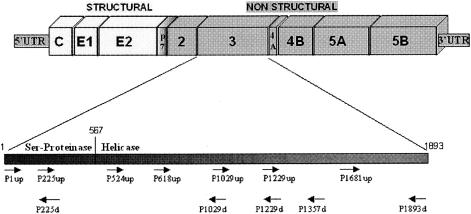
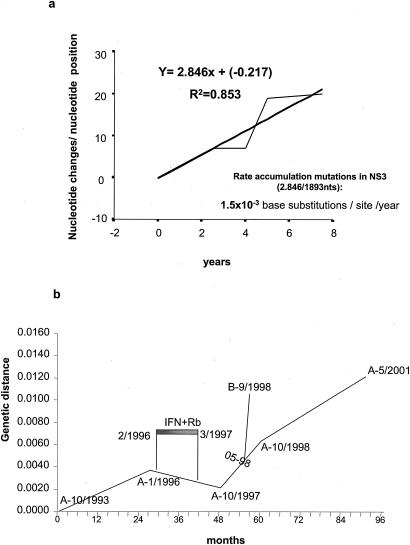
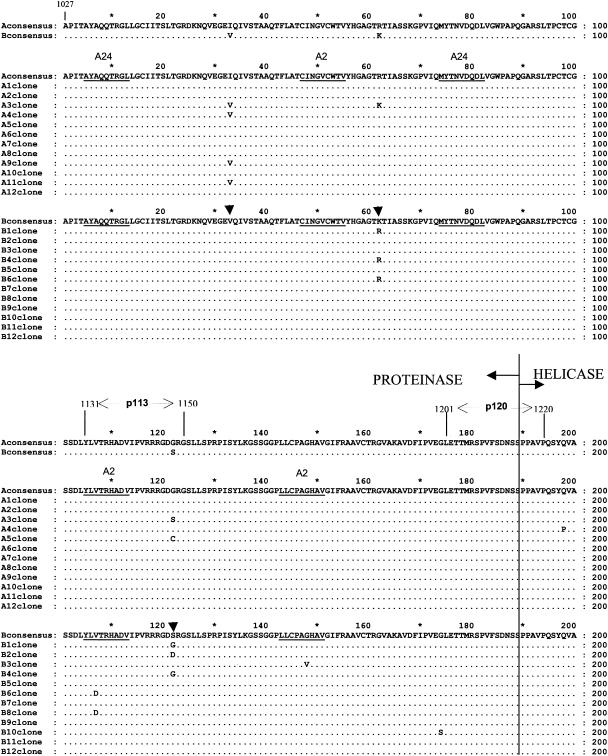
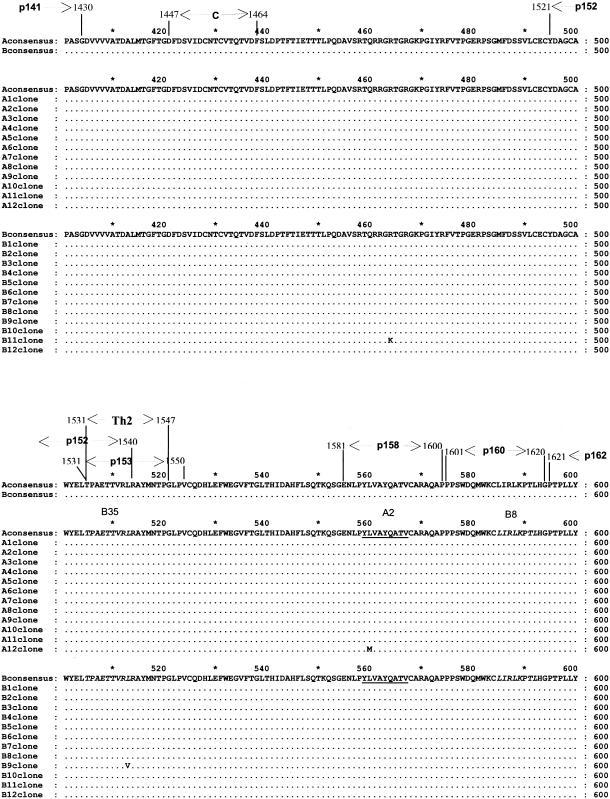
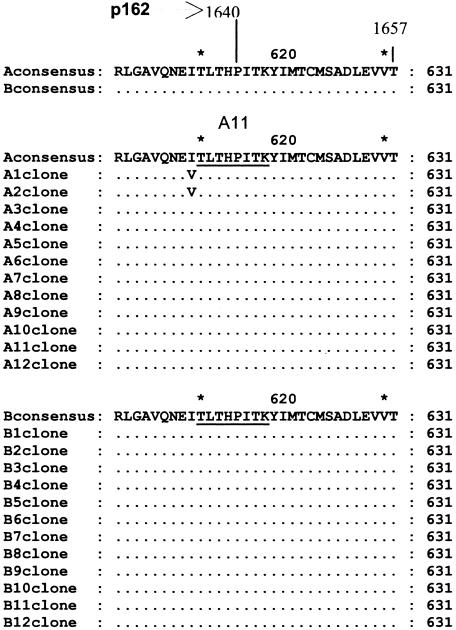
Sexual partners of patients infected with the hepatitis C virus (HCV) often have detectable HCV-specific T-cell responses in the absence of seroconversion, suggesting unapparent, spontaneously resolving infection. To determine whether differences in the evolutionary potential of bottlenecked inoculum may explain the low rate of HCV persistence after sexual exposure, we have investigated changes in the entire HCV nonstructural 3 (NS3) gene over time in a chronic carrier and compared his viral quasispecies with that of the acute-phase isolate of his sexual partner, who developed acute resolving hepatitis C. The overall rate of accumulation of mutations, estimated by regression analysis of six consecutive consensus NS3 sequences over 8 years, was 1.5 x 10(-3) mutations per site per year, with small intersample fluctuations related to changes in environmental conditions. Comparison of quasispecies parameters in one isolate of the chronic carrier with those of the acute-phase isolate of the infected partner revealed a higher heterogeneity and lower proportion of nonsynonymous mutations in the former. All NS3 sequences from the acute-phase isolate clustered with a single sequence from the chronic isolate, despite complete HLA mismatch between the patients, suggesting bottlenecking during transmission. The low risk of viral persistence after sexual exposure to HCV may be related to the selection of a limited number of viral particles carrying a particular combination of mutations which may further limit the potential of a relatively homogeneous quasispecies to rapidly diversify and overcome the immune response of the exposed host.
Figures

Similar articles
-
Transmission of low-density hepatitis C viral particles during sexually transmitted acute resolving infection.J Med Virol. 2008 Feb;80(2):242-6. doi: 10.1002/jmv.21037. J Med Virol. 2008. PMID: 18098146
-
Genetic variability of hepatitis C virus non-structural protein 3 and virus-specific CD8+ response in patients with chronic hepatitis C.J Med Virol. 2004 Apr;72(4):575-85. doi: 10.1002/jmv.20036. J Med Virol. 2004. PMID: 14981760
-
Conservation of hepatitis C virus nonstructural protein 3 amino acid sequence in viral isolates during liver transplantation.J Viral Hepat. 2009 Oct;16(10):732-7. doi: 10.1111/j.1365-2893.2009.01125.x. Epub 2009 Mar 25. J Viral Hepat. 2009. PMID: 19486468
-
Hepatitis C virus resistance to protease inhibitors.J Hepatol. 2011 Jul;55(1):192-206. doi: 10.1016/j.jhep.2011.01.011. Epub 2011 Feb 1. J Hepatol. 2011. PMID: 21284949 Review.
-
Biology and genetic heterogeneity of hepatitis C virus.Clin Exp Rheumatol. 1995 Nov-Dec;13 Suppl 13:S3-7. Clin Exp Rheumatol. 1995. PMID: 8730468 Review.
Cited by
-
Quasispecies and its impact on viral hepatitis.Virus Res. 2007 Aug;127(2):131-50. doi: 10.1016/j.virusres.2007.02.001. Epub 2007 Mar 8. Virus Res. 2007. PMID: 17349710 Free PMC article. Review.
-
Viral quasispecies evolution.Microbiol Mol Biol Rev. 2012 Jun;76(2):159-216. doi: 10.1128/MMBR.05023-11. Microbiol Mol Biol Rev. 2012. PMID: 22688811 Free PMC article. Review.
-
New strategies for the treatment of hepatitis C virus infection and implications of resistance to new direct-acting antiviral agents.Infect Drug Resist. 2010;3:133-45. doi: 10.2147/IDR.S7136. Epub 2010 Nov 23. Infect Drug Resist. 2010. PMID: 21694902 Free PMC article.
-
Temporal variations in the hepatitis C virus intrahost population during chronic infection.J Virol. 2011 Jul;85(13):6369-80. doi: 10.1128/JVI.02204-10. Epub 2011 Apr 27. J Virol. 2011. PMID: 21525348 Free PMC article.
-
Molecular epidemiology and putative origin of hepatitis C virus in random volunteers from Argentina.World J Gastroenterol. 2013 Sep 21;19(35):5813-27. doi: 10.3748/wjg.v19.i35.5813. World J Gastroenterol. 2013. PMID: 24124326 Free PMC article.
References
-
- Altman, J. D., and M. B. Feinberg. 2004. HIV escape: there and back again. Nat. Med. 10:229-230. - PubMed
-
- Bronowicki, J. P., D. Vetter, G. Uhl, H. Hudziak, A. Uhrlacher, J. M. Vetter, and M. Doffoel. 1997. Lymphocyte reactivity to hepatitis C virus (HCV) antigens shows evidence for exposure to HCV in HCV-seronegative spouses of HCV-infected patients. J. Infect. Dis. 176:518-522. - PubMed
-
- Cerny, A., and F. V. Chisari. 1999. Pathogenesis of chronic hepatitis C: immunological features of hepatic injury and viral persistence. Hepatology 30:595-601. - PubMed
Publication types
MeSH terms
Substances
LinkOut - more resources
Full Text Sources
Molecular Biology Databases
Research Materials
